Explore Clea 2.0: Essential Features
Once your device is connected to Clea 2.0, you can start exploring its core capabilities: remote device management, file transfer, application deployment, AI workflows, telemetry, data orchestration and over-the-air updates. Each activity introduces a feature you can explore in your Clea environment.
If you have not connected your device yet, follow Get Started with Clea 2.0 first.
Before you begin
You will need:
- A device registered in Clea 2.0 and connected to the internet.
- A Clea account with access to that device.
- A browser to access your Clea instance.
- For the deployment exercises, an application or container image compatible with your device.
The features and actions available to you depend on your device and account permissions. In this guide, use a test device whenever possible, especially when restarting it or deploying an application.
1. Check your device connection
What you'll do: Confirm that your device is available for remote management.
For device registration and One-Click Provisioning, see Get Started with Clea 2.0.
-
Sign in to your Clea instance.
-
In the main navigation, expand Device Manager, then select Devices.
-
Find your device in the list. You can use the list view and its available filters to locate it.
-
Check the CONNECTIVITY column. A connected device is marked CONNECTED.
-
Select your device to open its details page. Check the SYSTEM ONLINE indicator.
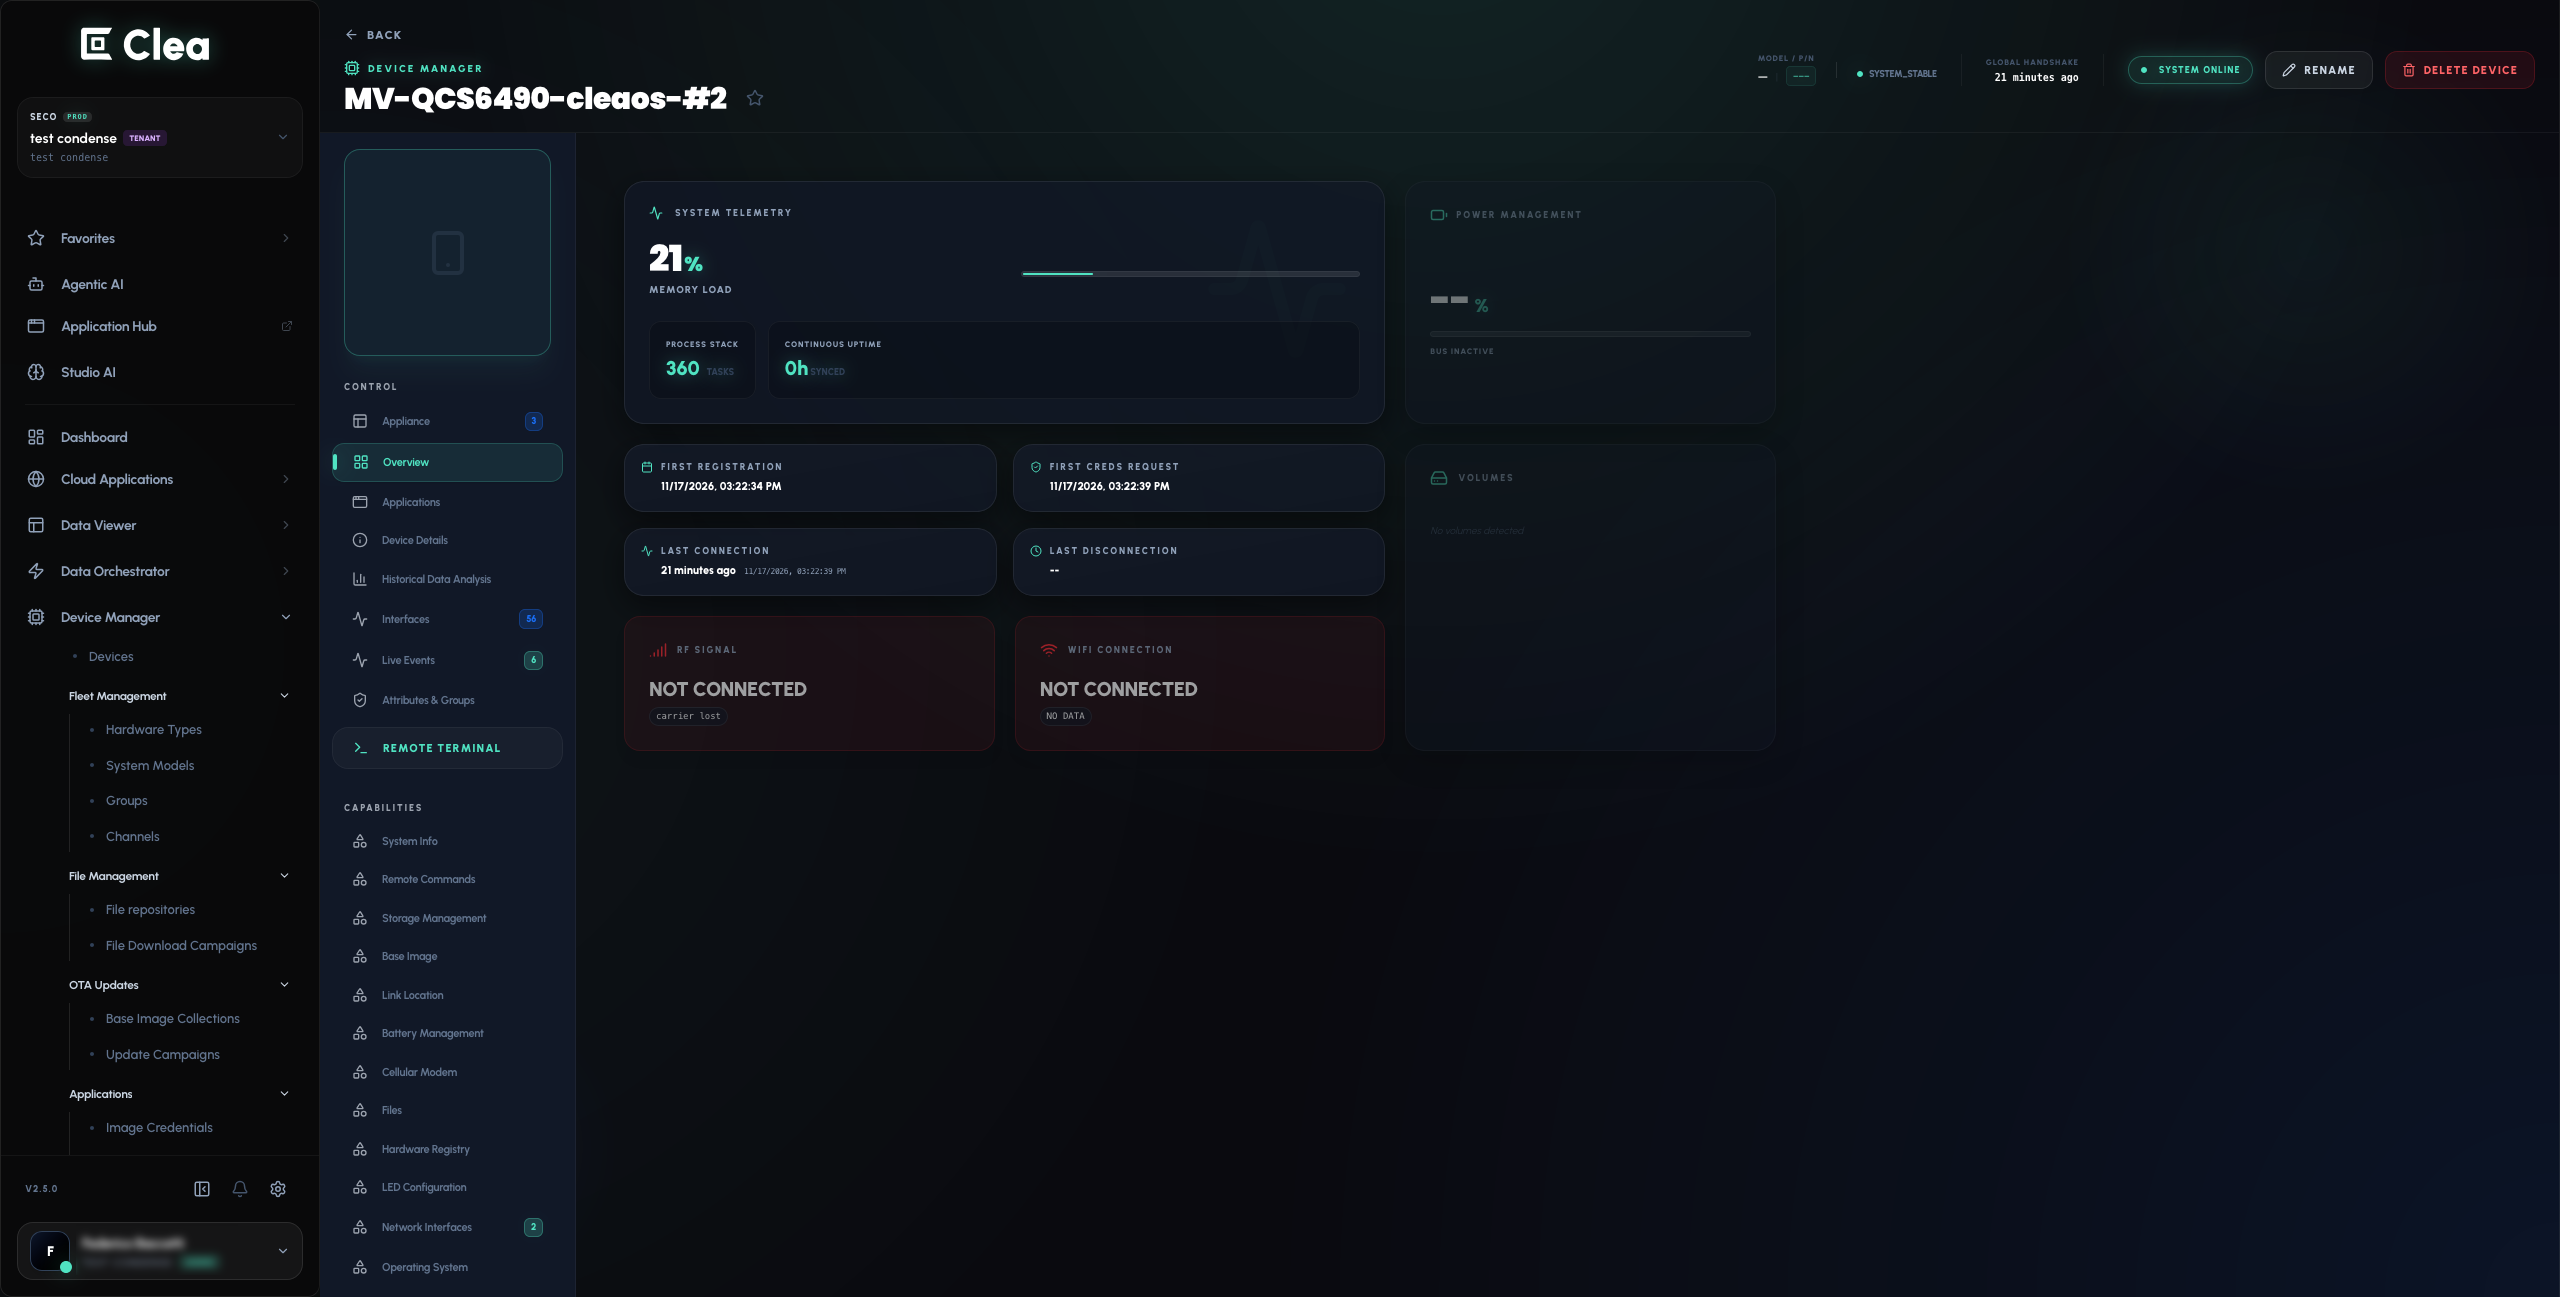
Expected result: Your device shows as connected and you can open its management page.
2. Open a remote terminal
What you'll do: Interact with your device's command line from a browser.
Clea provides browser-based remote terminal access through a managed connection using ttyd. This allows access without directly addressing the device through a public IP address.
-
In the main navigation, expand Device Manager and select Devices.
-
Select your connected device to open its details.
-
In the device details navigation on the left, under CAPABILITIES, select Remote Terminal.
-
On the Remote Terminal page, locate the INTERACTIVE SHELL panel.
-
When the panel shows SYSTEM READY, select INITIALIZE SESSION.
-
Once the terminal is available, try a read-only command:
uname -a -
To check how long the device has been running, you can also use:
uptime -
End the terminal session when you have finished.
Expected result: The terminal displays information returned by your device.
Important: Terminal commands run on the selected device. Do not execute commands that modify its configuration unless you understand their effects.
3. Reboot your device remotely
What you'll do: Restart your device using a command sent through Clea.
- In the main navigation, expand Device Manager and select Devices.
- Select the connected device you want to restart.
- In the device details navigation on the left, under CAPABILITIES, select Remote Commands.
- On the Remote Commands page, locate the REBOOT DEVICE panel.
- Select SEND REBOOT to initiate the operation. Follow any confirmation displayed by the interface.
- Return to Device Manager > Devices and monitor the device connectivity as it restarts.
- Check that it returns to CONNECTED.
Expected result: The device reboots and reconnects to Clea.
Important: A reboot interrupts active applications and remote sessions. Save any work and avoid restarting a device that is performing a critical operation.
4. Transfer files
What you'll do: Send a test file to your device and explore how to request a file from it.
Use the Files capability to send or request files from your device. For your first test, use a small, non-sensitive file.
4.1. Send a file to your device
-
Create a small text file on your computer, for example
clea-test.txt. -
In the main navigation, open Device Manager > Devices and select your connected device.
-
In the device details navigation on the left, under CAPABILITIES, select Files.
-
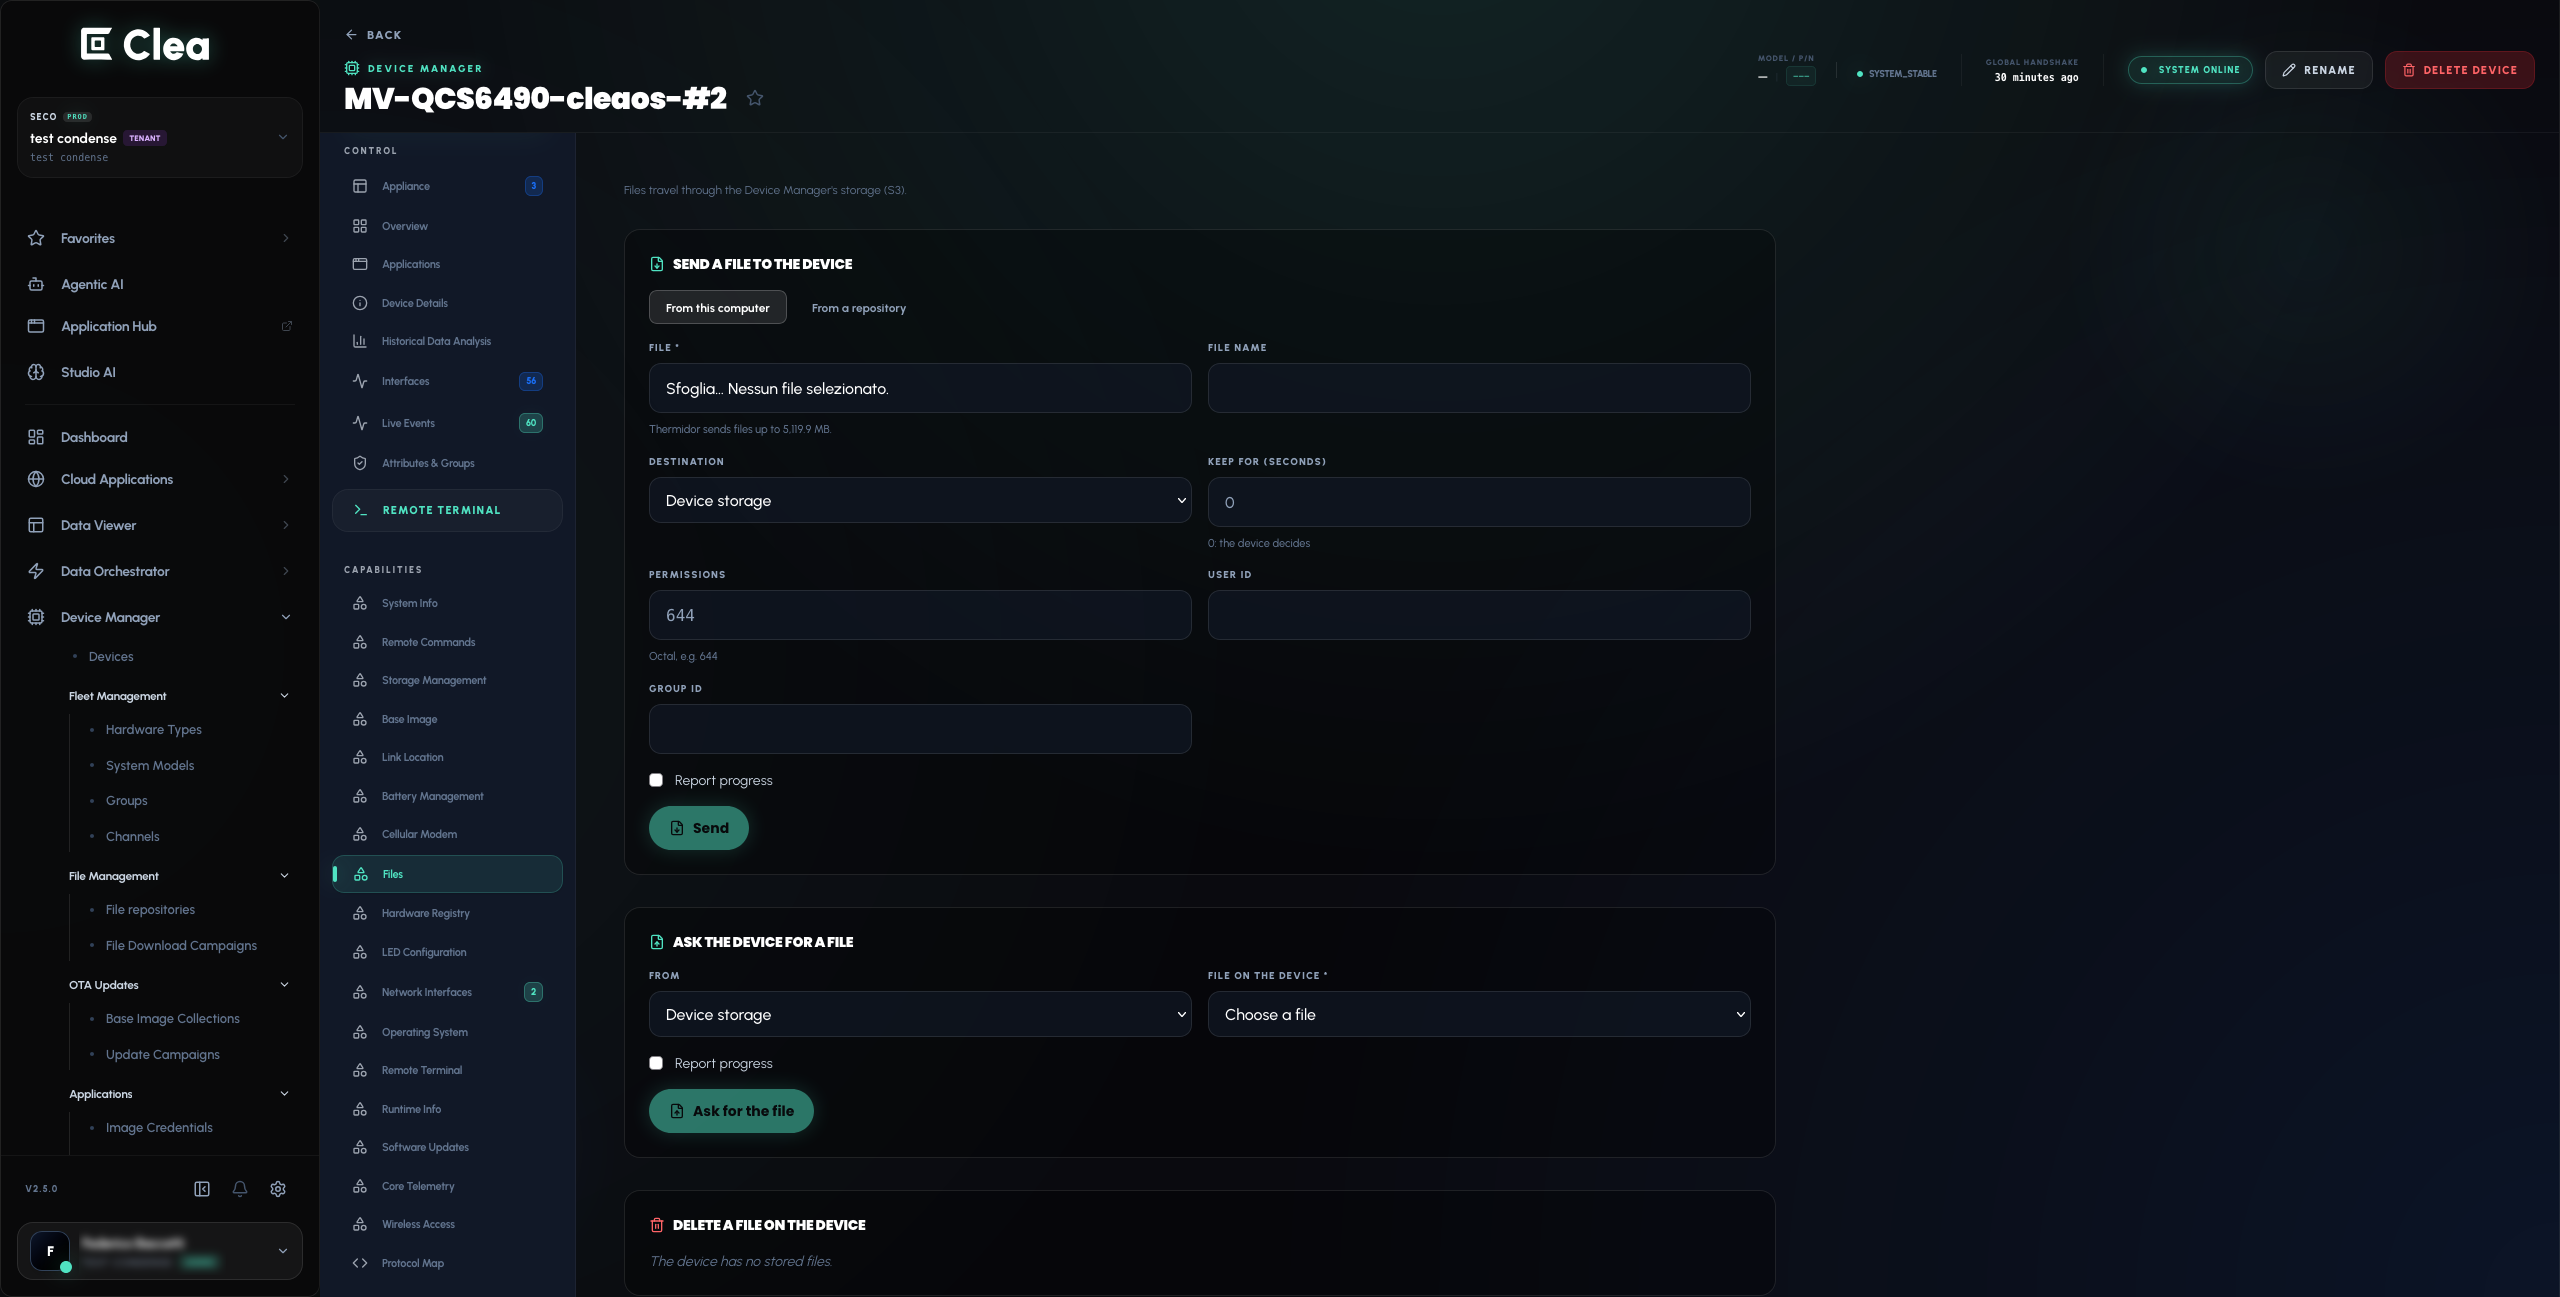
In Files, find SEND A FILE TO THE DEVICE and choose From this computer.
-
Select
clea-test.txtin the FILE field. -
Complete the required information, including FILE NAME and DESTINATION. Use a destination that is writable on your device.
-
Review any additional options you need, including KEEP FOR (SECONDS), PERMISSIONS, USER ID, GROUP ID and Report progress.
-
Select Send when the required fields are complete.
-
Review the result in REQUESTS, and verify the file on the device if needed.
Expected result: Clea accepts the transfer request and the file becomes available at the selected destination on the device.
You can also explore From a repository if your file is hosted in a repository accessible to the platform.
4.2. Request a file from your device
- Remain in the device details page, under CAPABILITIES > Files, and find ASK THE DEVICE FOR A FILE.
- Specify the device file using the fields provided.
- Select Ask for the file once the required details are complete.
- Consult REQUESTS to review the operation and follow the available retrieval options.
Expected result: A file request is recorded for the device, and its result can be reviewed in the interface.
Example use case: Transfer configuration files, logs or test data that your application needs. File transfer by itself does not execute the files you send.
5. Deploy a containerized application
What you'll do: Select an available Edge Application, deploy a release to your device and inspect its execution status.
5.1. Deploy an available Edge Application
-
In the main navigation, open Device Manager > Devices and select your connected device.
-
In the device details navigation on the left, under CONTROL, select Applications.
-
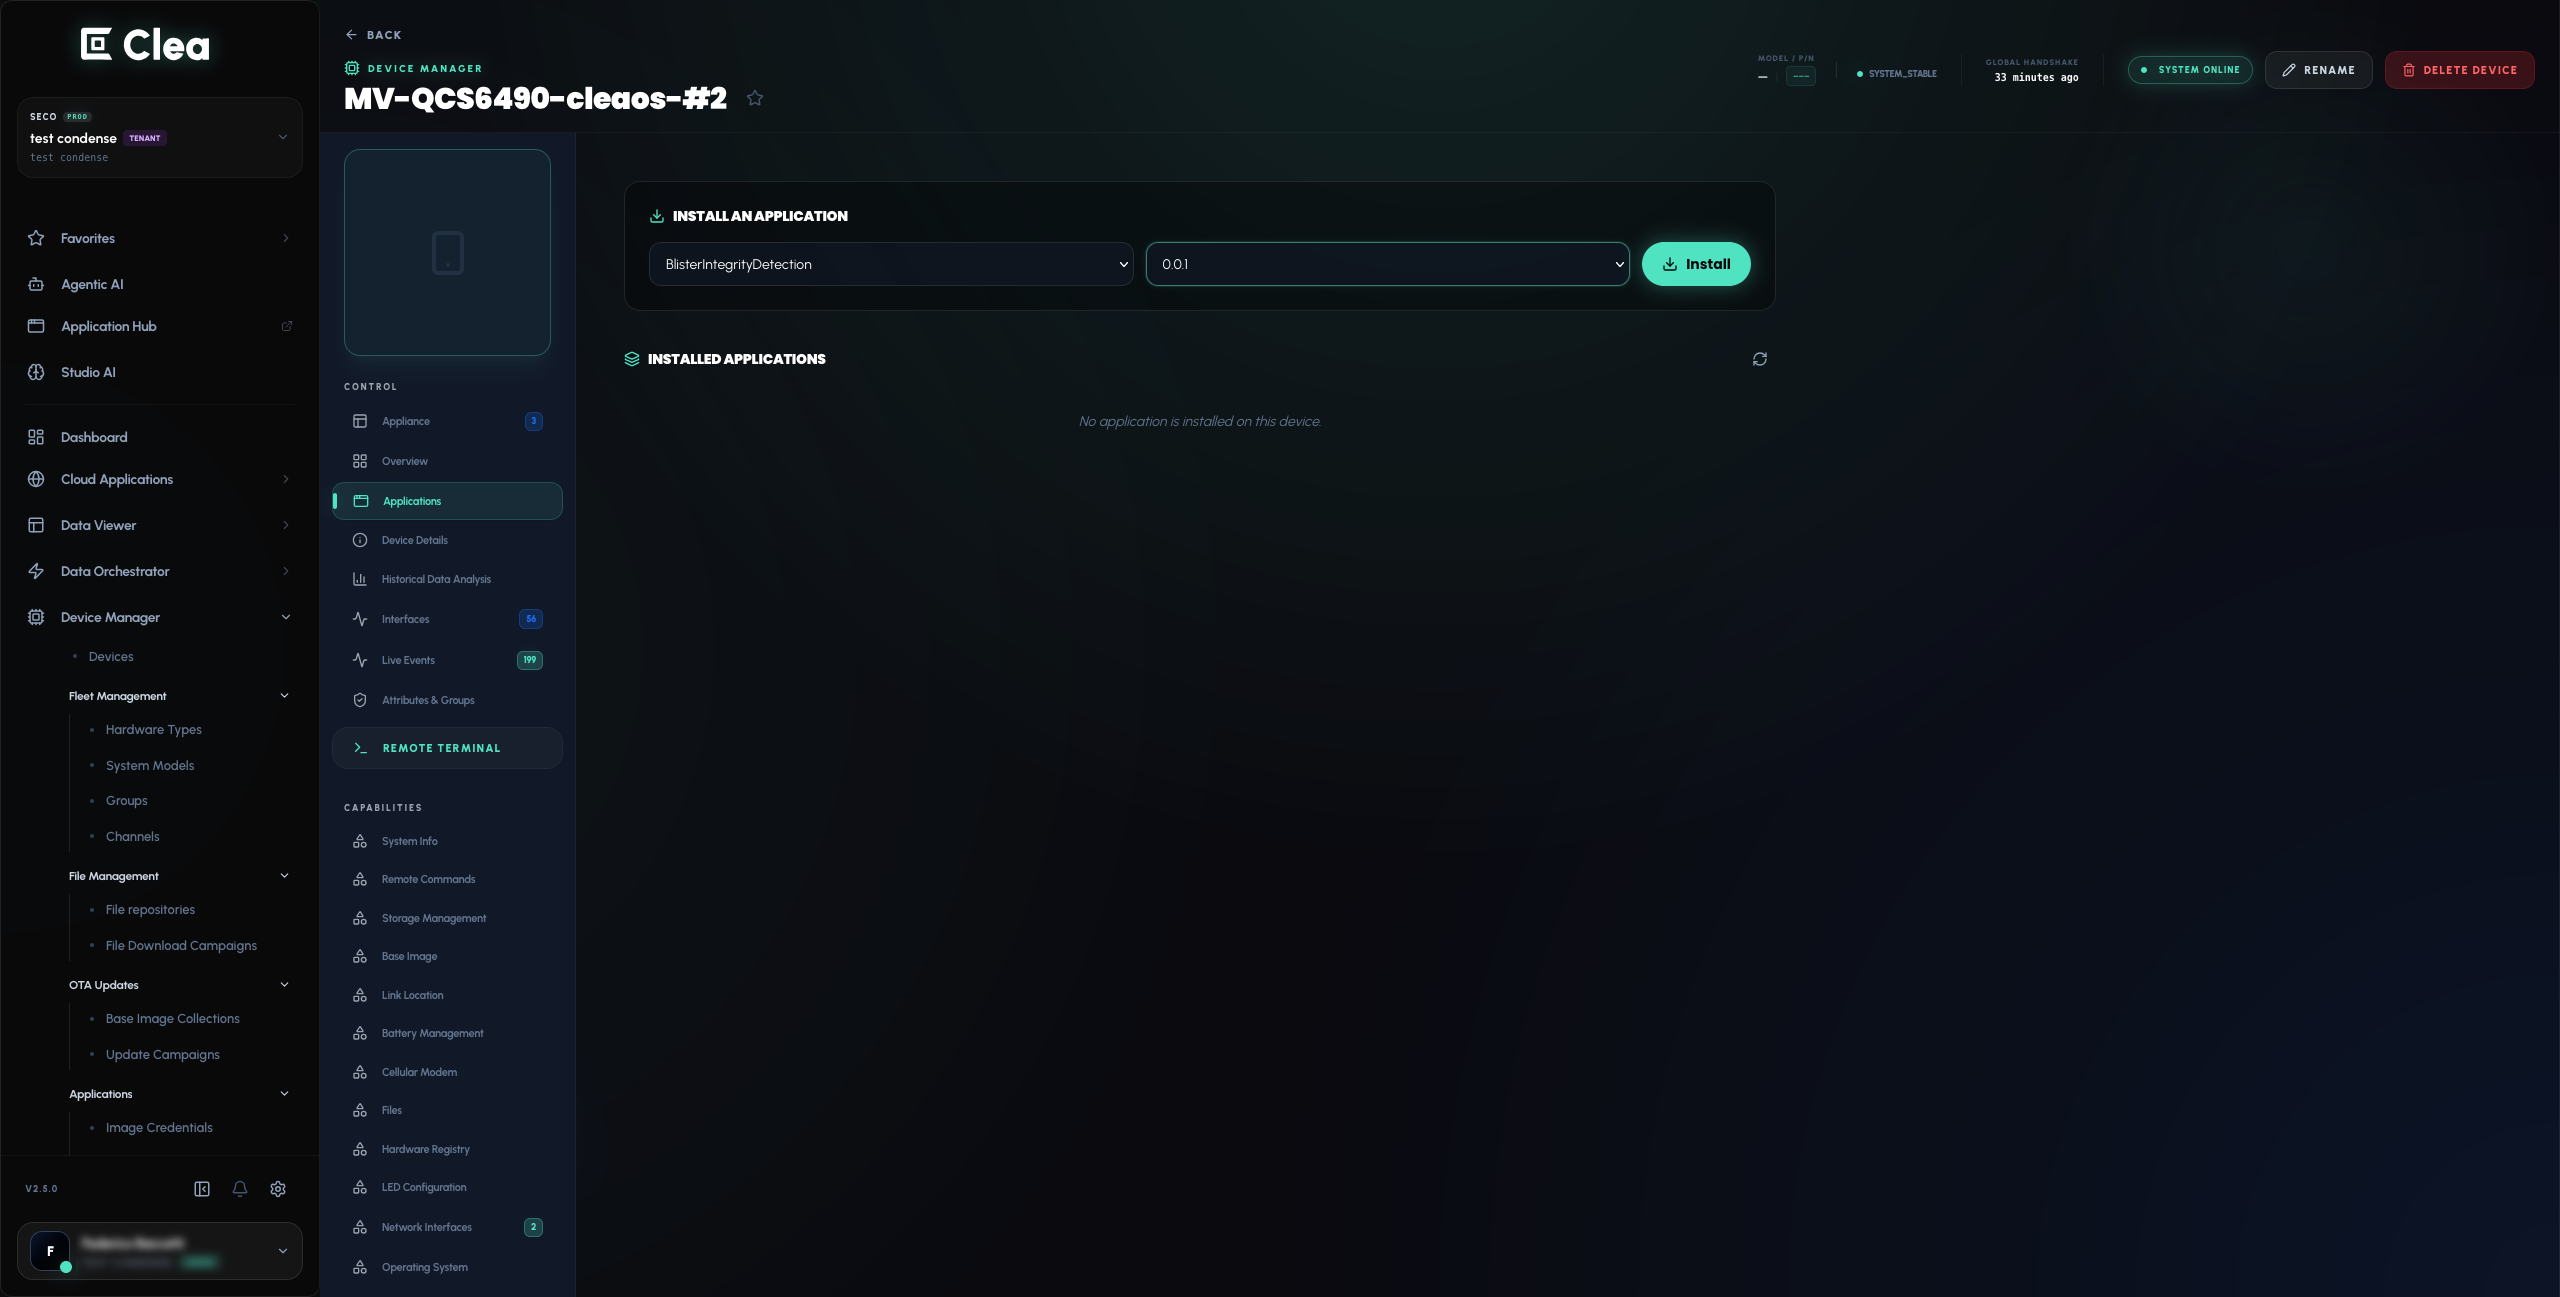
Locate the INSTALL AN APPLICATION panel.
-
Use Choose an application to select an available application.
-
Use Choose a release to select a release compatible with your device.
-
Select Install to start installation of the selected release on this device.
-
Under INSTALLED APPLICATIONS, open the deployed application to review its status and any available logs.
Expected result: The application is installed on your device and its execution status is available for inspection. Depending on the application, you may see states such as Starting and Running.
To view application deployments across your fleet, use the main navigation: Device Manager > Applications > Deployments. Available actions can include Start, Stop, Upgrade and Remove from the device.
Note: You can only install releases compatible with the target device's system model. If the interface displays No application has a release for this device's system model, there is no compatible release available to select in that view. In that case, choose a supported device or obtain a compatible application release before continuing.
5.2. Explore deployment from your own registry
You can also work with container images hosted in a registry you manage, subject to your account's permissions and the application configuration.
-
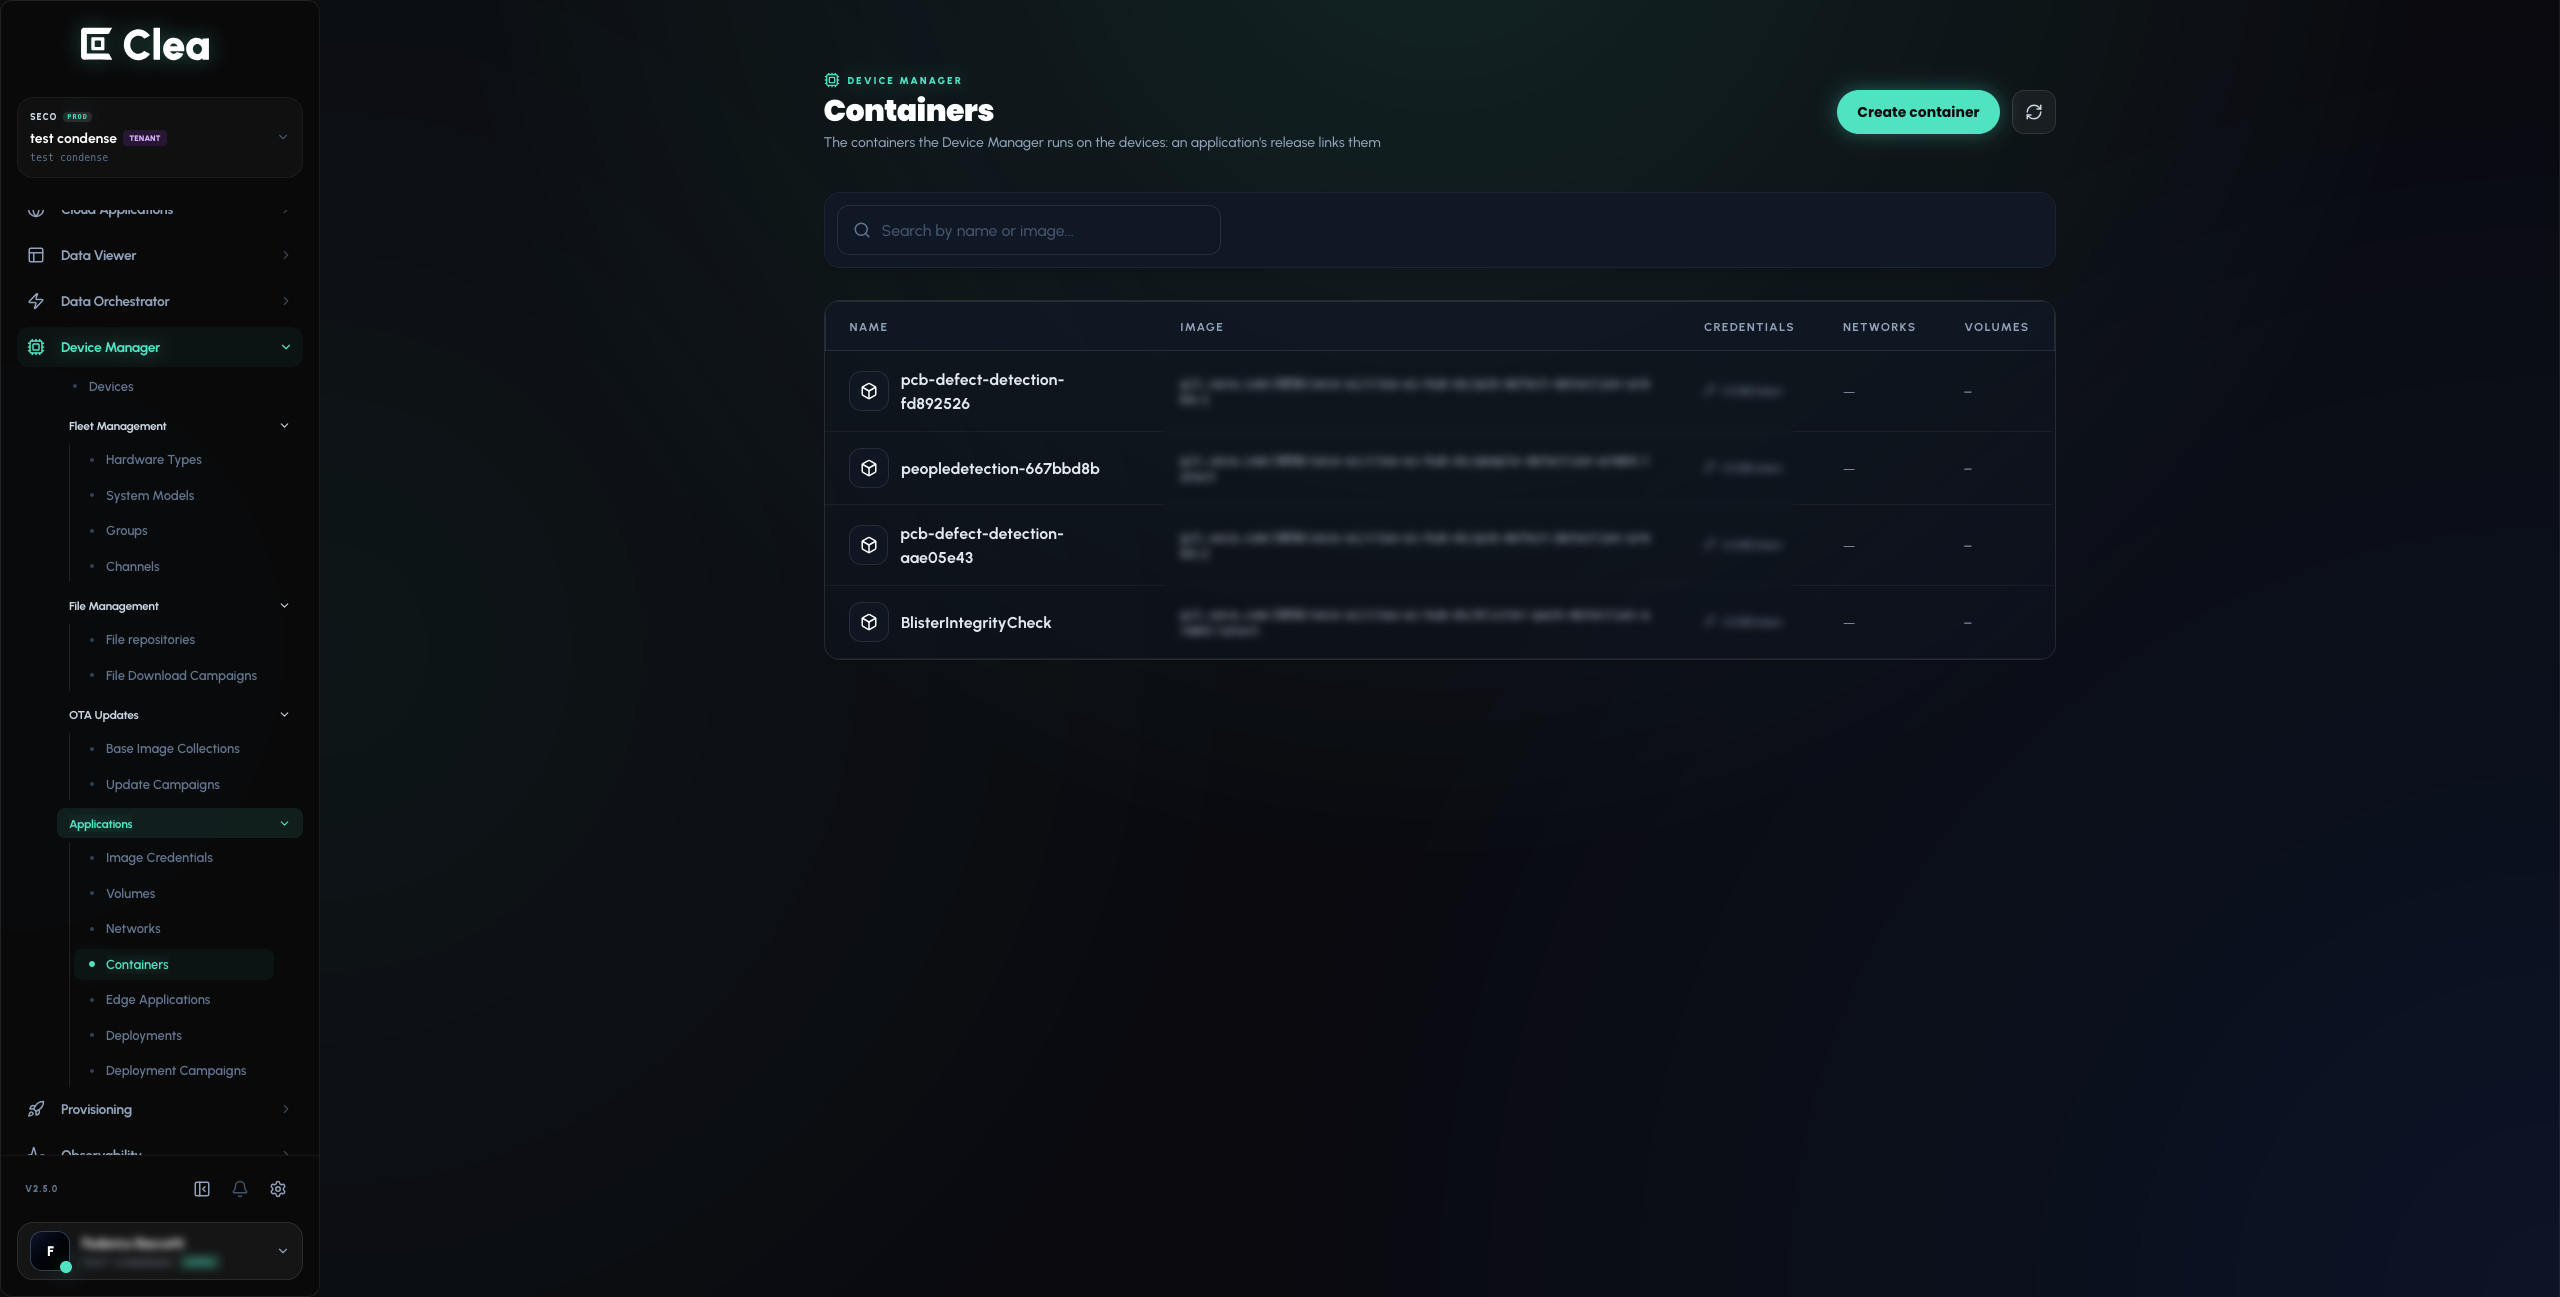
In the main navigation, open Device Manager > Applications > Containers.
-
Select Create container to open the container configuration editor.
-
Under Image, enter the container image reference. Review Network, Storage, Resources, Security, Runtime & Env and Device Mappings as needed.
-
If your image is stored in a private registry, review Device Manager > Applications > Image Credentials in the main navigation for the registry authentication settings.
-
Select Create container when the configuration is ready. Once the container is associated with a compatible Edge Application release, use the installation flow in section 5.1 to deploy the release to a device.
Expected result: After a container is created and associated with a compatible Edge Application release, that release can be selected for installation on a device. Use the device installation page to select the prepared release.
6. Explore Application Hub and Studio AI
What you'll do: Discover an AI application in Application Hub, explore and configure its workflow in Studio AI, publish a release to Clea and then install that release on your connected device.
Start from the catalog and publish an application release to Clea, then install it on your device through Device Manager. For an overview of the marketplace, see What is SECO Application Hub.
6.1. Find an application in Application Hub
- Open Application Hub.
- Browse the application catalog or use the search and available filters to find an application relevant to your use case.
- Open its detail page. Review the APP DETAILS and SUPPORTED CHIPSETS sections to understand the application and check its target-hardware compatibility. Review any additional resources and licensing information provided for that application.
- Select Deploy on the application's detail page.
- Sign in with your Clea account if the deployment flow requests authentication.
6.2. Choose your Clea instance in CLEA Bridge
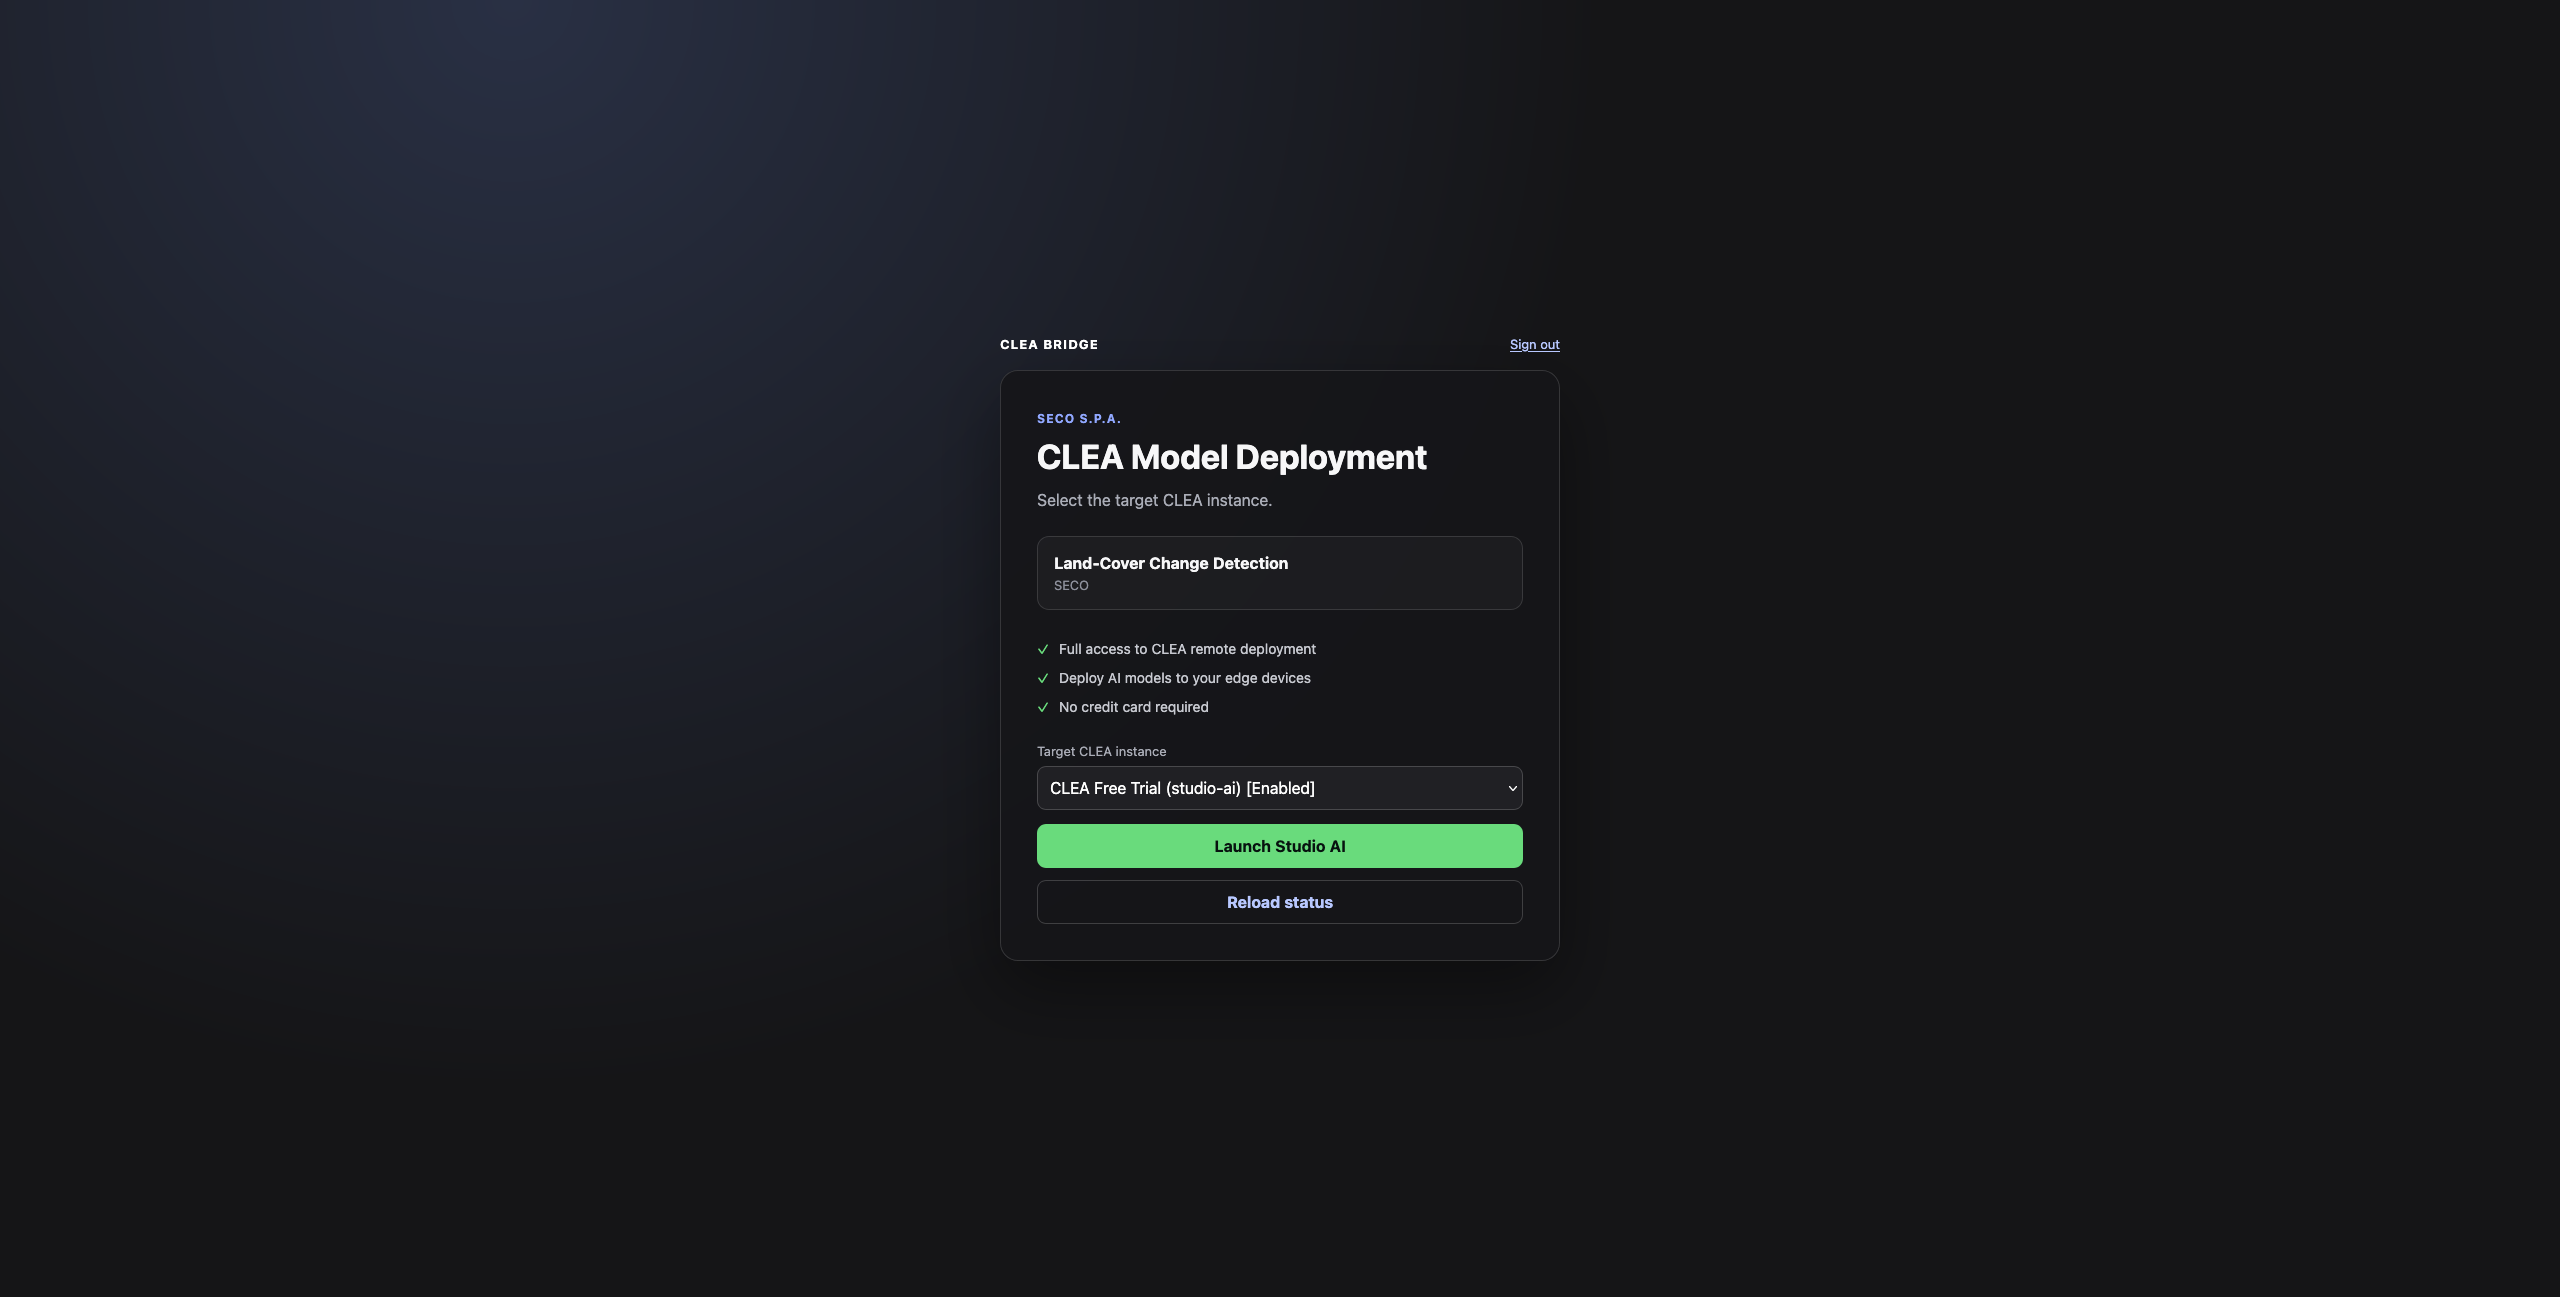
The deployment flow opens CLEA Bridge, on a page titled CLEA Model Deployment.
-
Check that the application shown in the page matches the one you selected in Application Hub.
-
In Target CLEA instance, select the Clea environment you intend to use. Only instances available to your account can be selected.
-
Select Launch Studio AI to continue.
6.3. Explore and edit the application in Studio AI
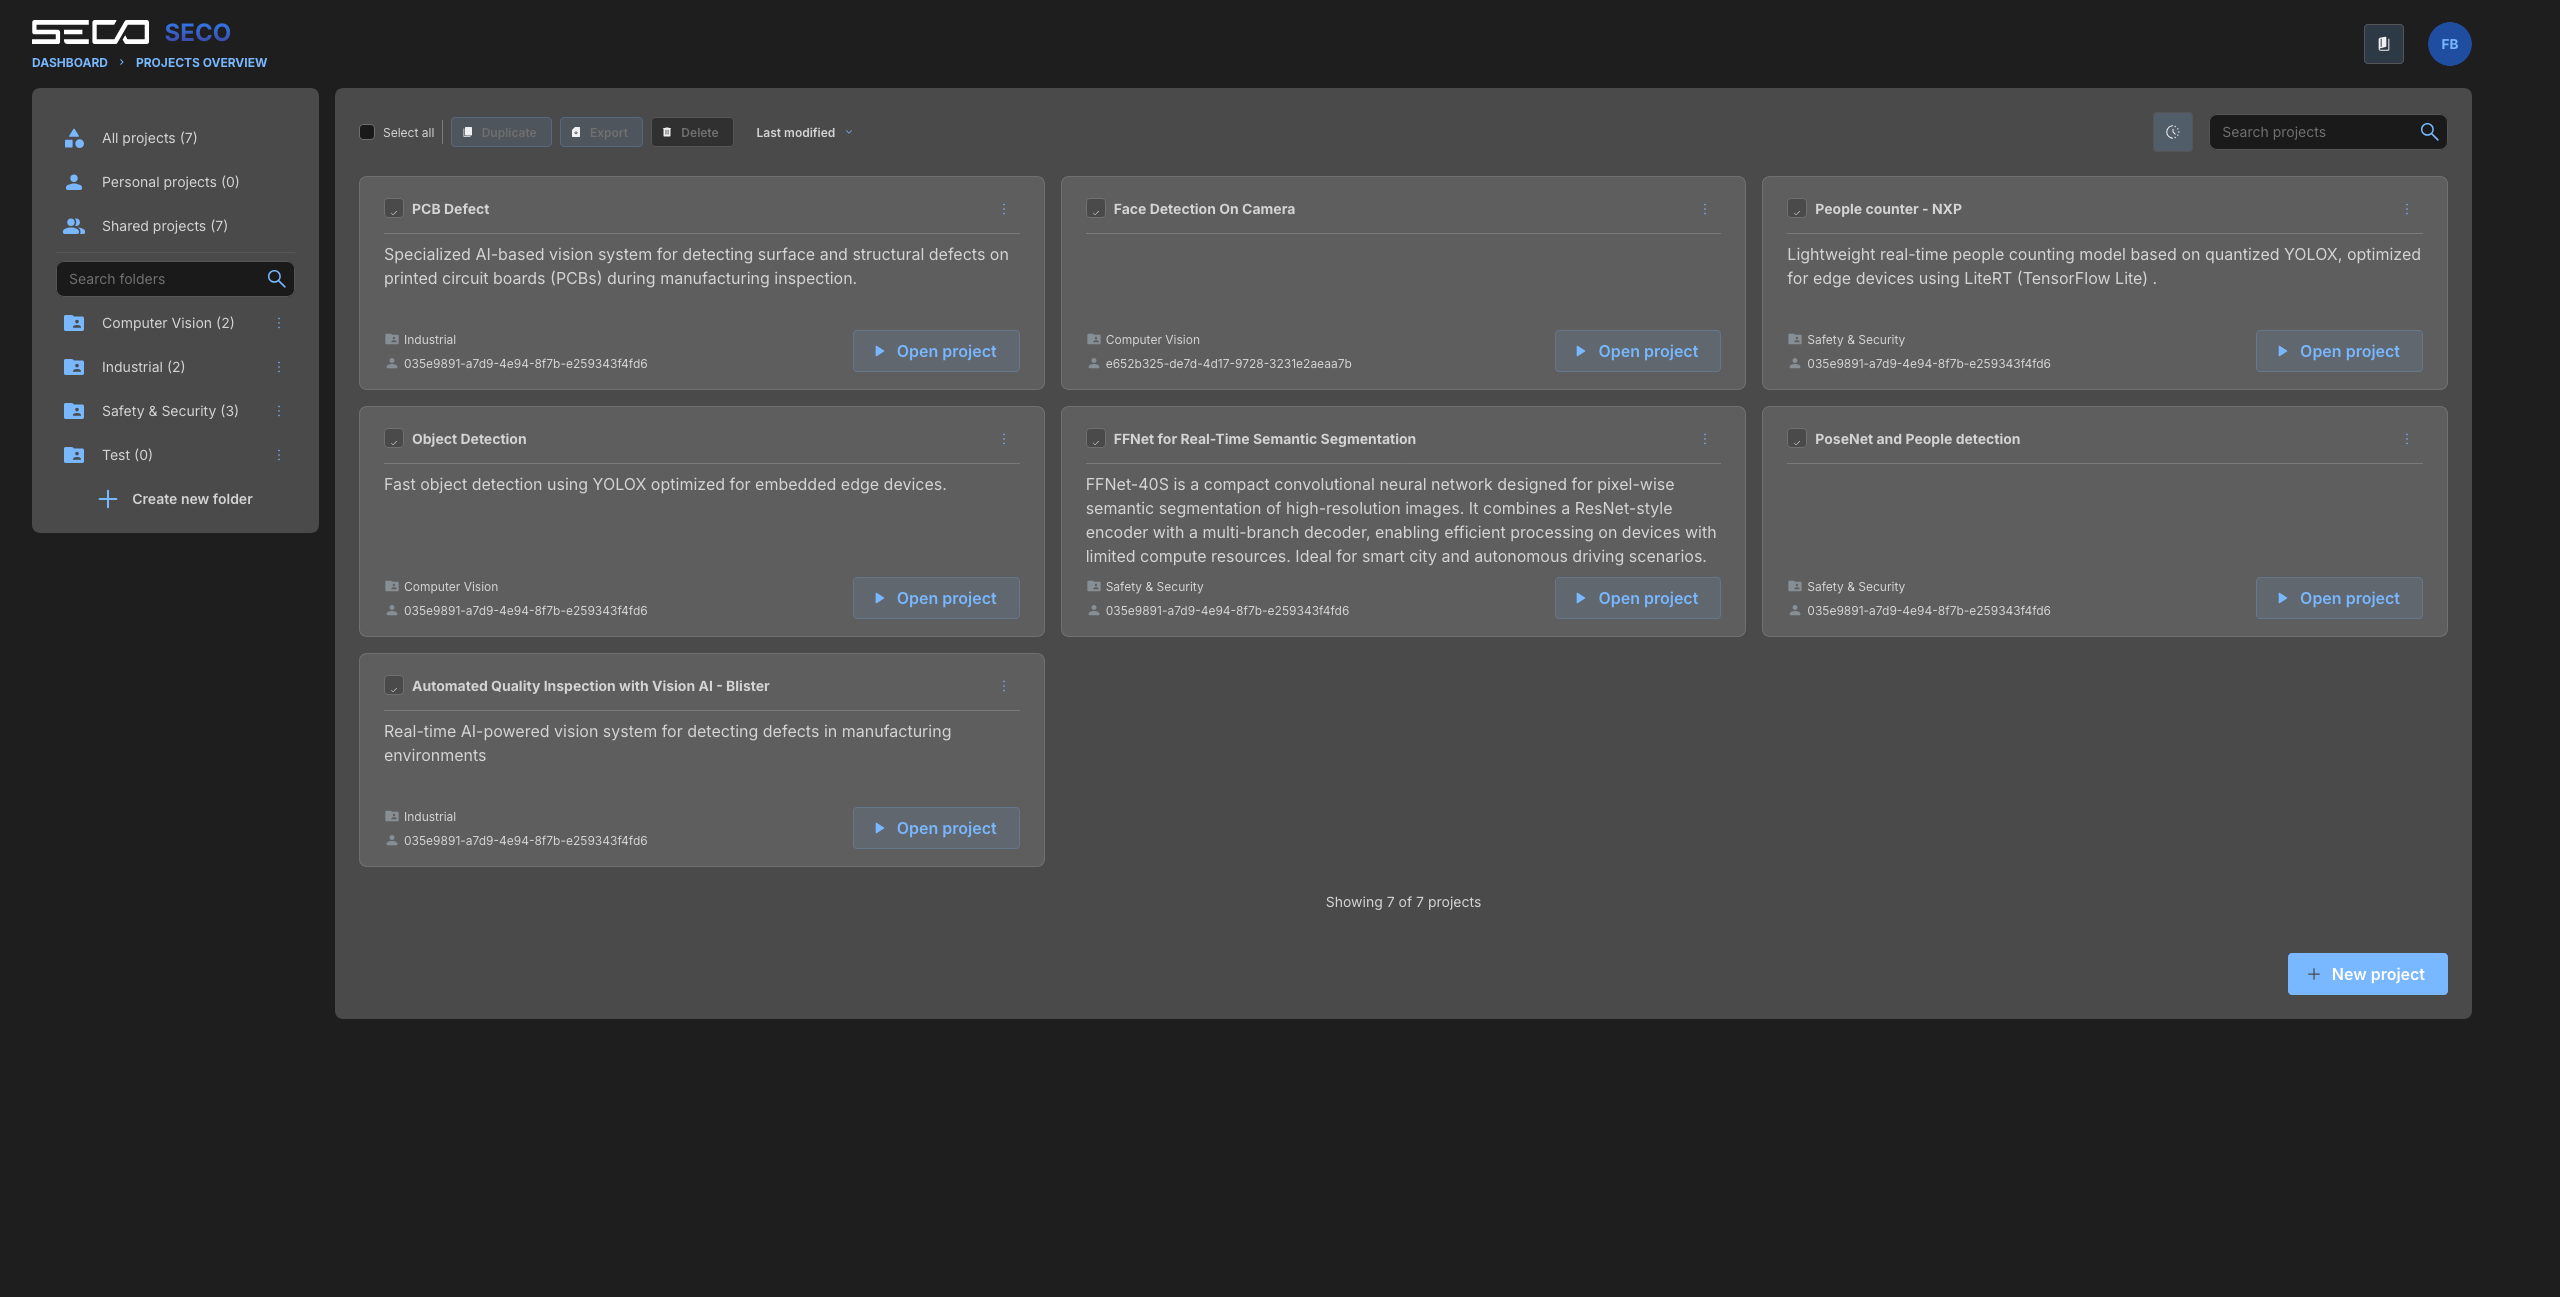
Studio AI provides a PROJECTS OVERVIEW page with personal and shared projects and a New project action.
-
If you are taken to PROJECTS OVERVIEW, locate the relevant project and select Open project. You can also select New project to start a separate workflow.
-
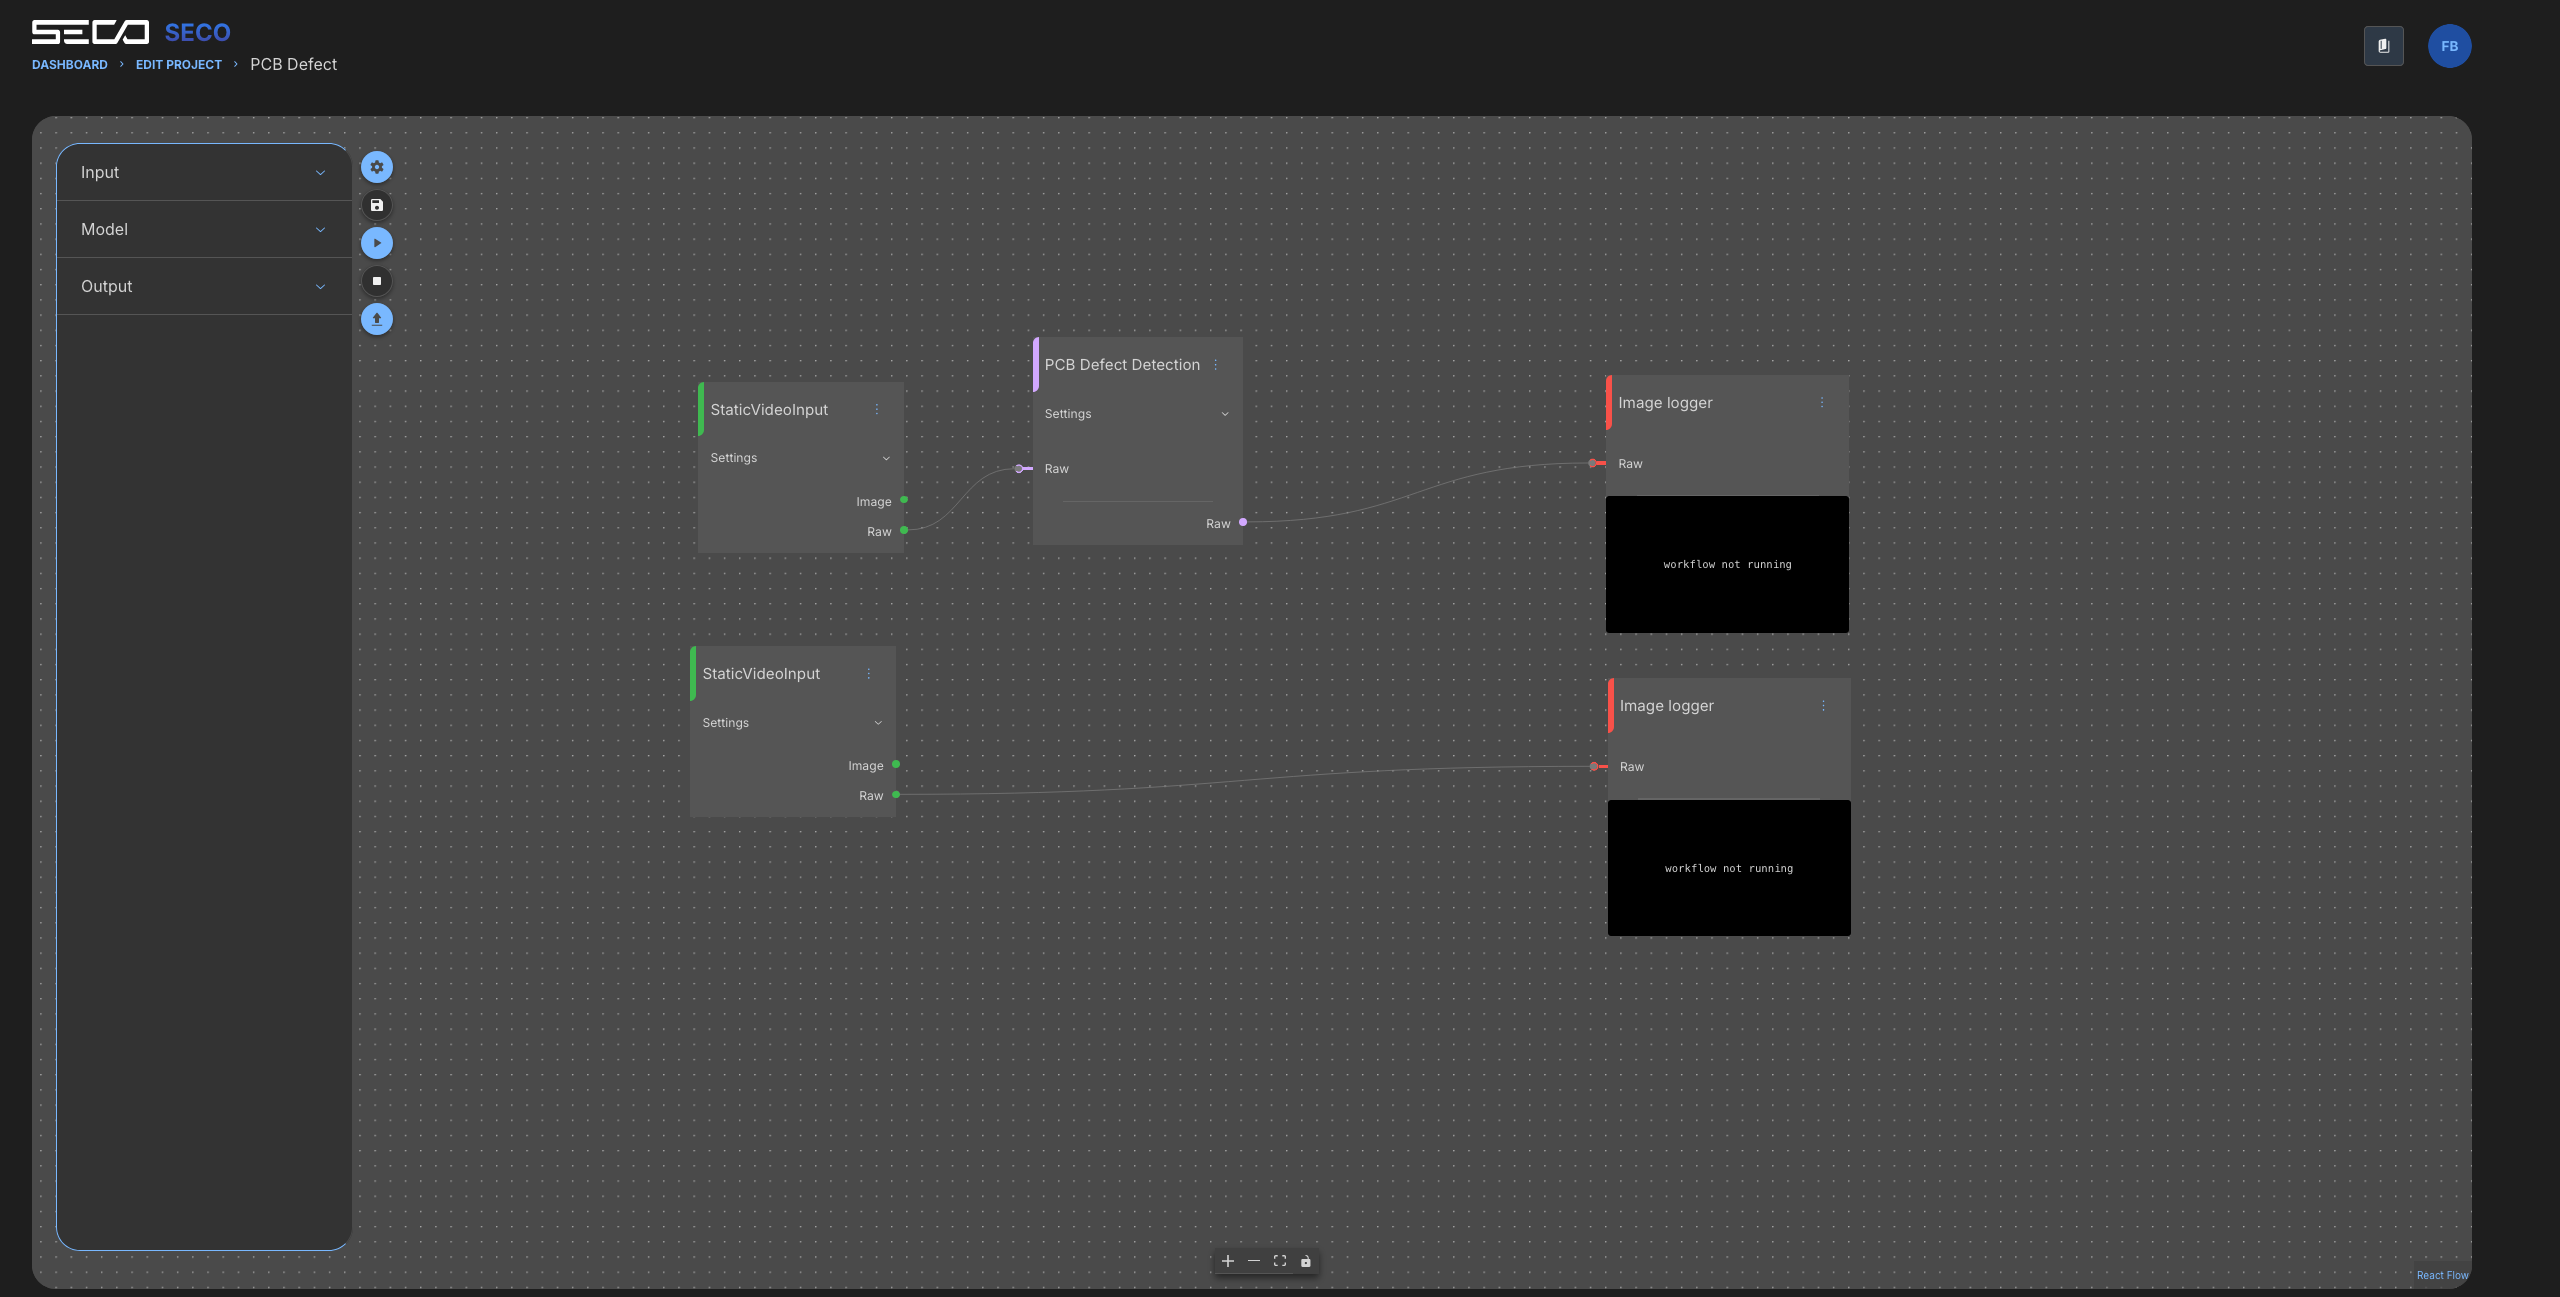
In the visual editor, inspect the blocks and their connections. The left panel groups available bricks under Input, Model and Output.
-
Select a brick to review its Settings. Modify the input, processing or output configuration as required by your application.
-
Review the connections between bricks, making sure the workflow has the intended input and output paths.
-
Use the editor's available execution and output controls to explore testing before deployment, when supported by the project and environment.
6.4. Publish the application to Clea
Use Deploy to edge in Studio AI to publish an application release to Clea. Install the published release on your device through Device Manager in the next section.
-
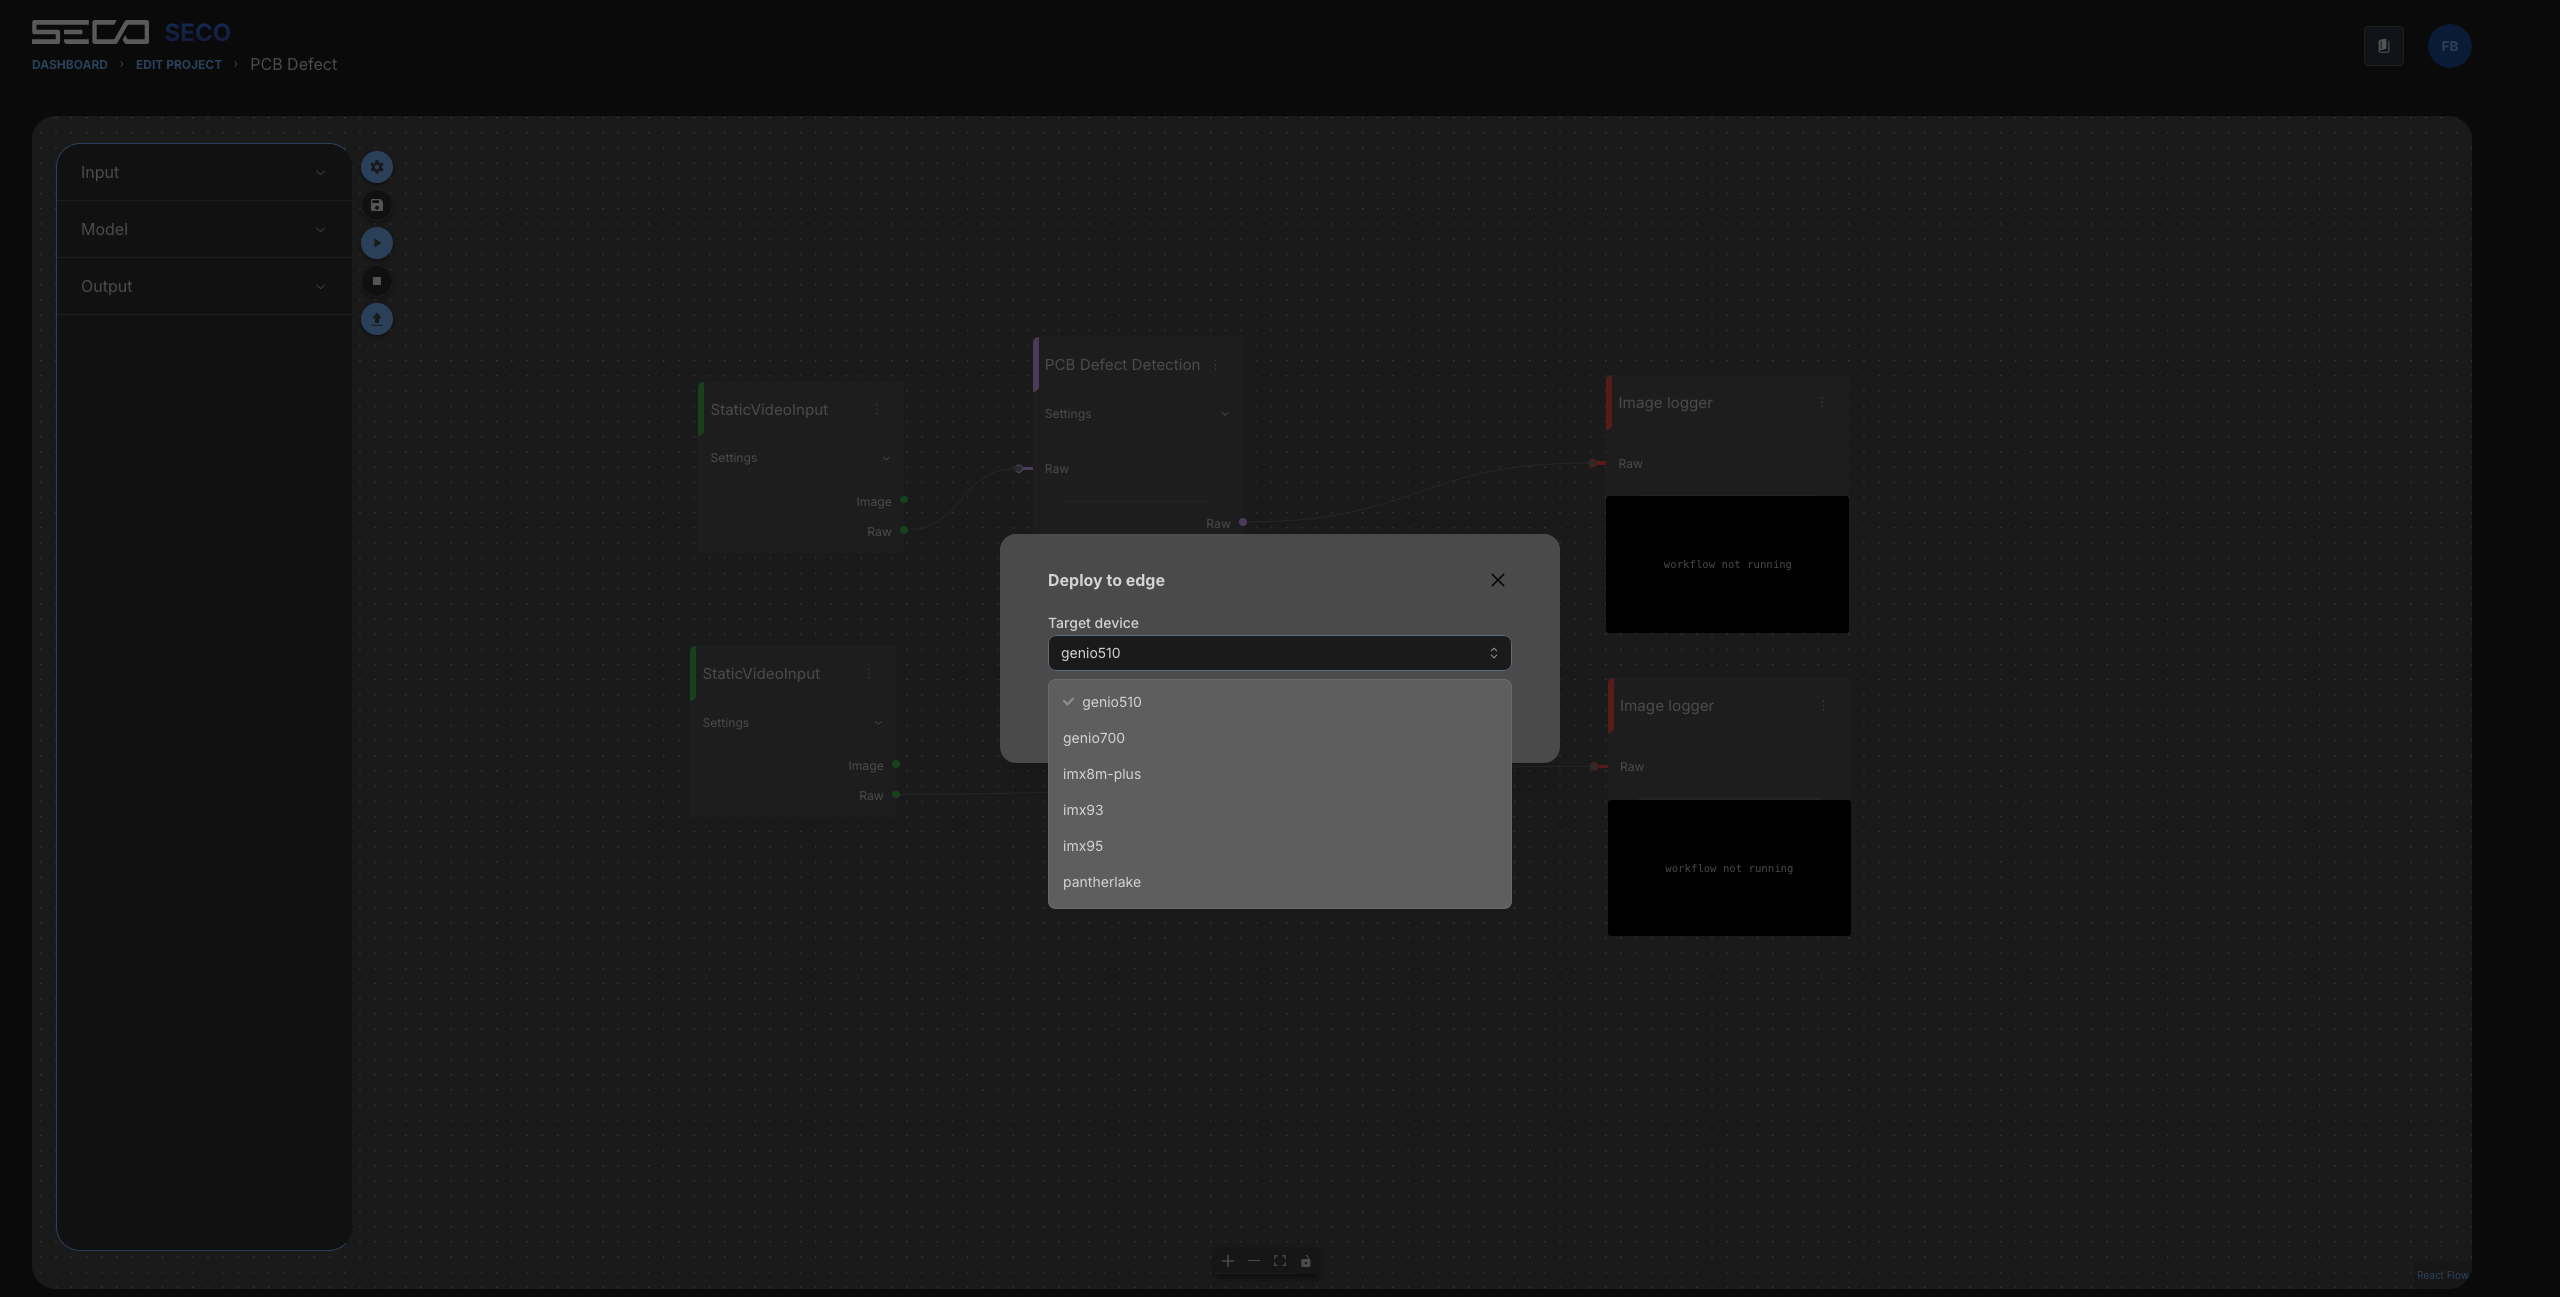
In the Studio AI editor toolbar, select Deploy to edge.
-
In the Deploy to edge dialog, open Target device and select a hardware platform compatible with your intended device. If your platform is unavailable, check compatibility before continuing.
-
Continue to Accelerator per brick and review the accelerator assigned to each brick, such as CPU.
-
Select Next to proceed to the release information.
-
Review Application name and enter a Release name (for example,
1.0for an initial release). -
Select Deploy to publish the application release to Clea.
-
Return to Clea. In the main navigation, expand Device Manager, then Applications, and select Edge Applications to find the published release when it becomes available.
Expected result: The application and its release become available in Clea for installation on compatible devices.
6.5. Install the application on your device
Once the application release is available in Clea, use the Device Manager to distribute it to a physical device:
- In the Clea main navigation, open Device Manager > Devices.
- Select the device on which you want to run the application.
- In the device details navigation, under CONTROL, open Applications and locate the INSTALL AN APPLICATION panel.
- Under Choose an application, select the application published from Studio AI.
- Under Choose a release, select the release you just created.
- Select Install to start installing the selected release.
- Under INSTALLED APPLICATIONS, inspect the application's status and available logs. You can also refer to the standard installation flow in section 5.1.
Expected result: After installation succeeds, the application is available on the selected device, where you can review its execution status.
Important: In Studio AI, select the target hardware platform. Then select the physical device in Device Manager. The available hardware targets may not include every Evaluation Kit configuration. If your hardware target is missing, or if your release does not appear in the application's selector, verify compatibility and release availability before continuing.
7. Explore Agentic AI
What you'll do: Discover Clea's AI-assisted fleet management interface and its integration options.
-
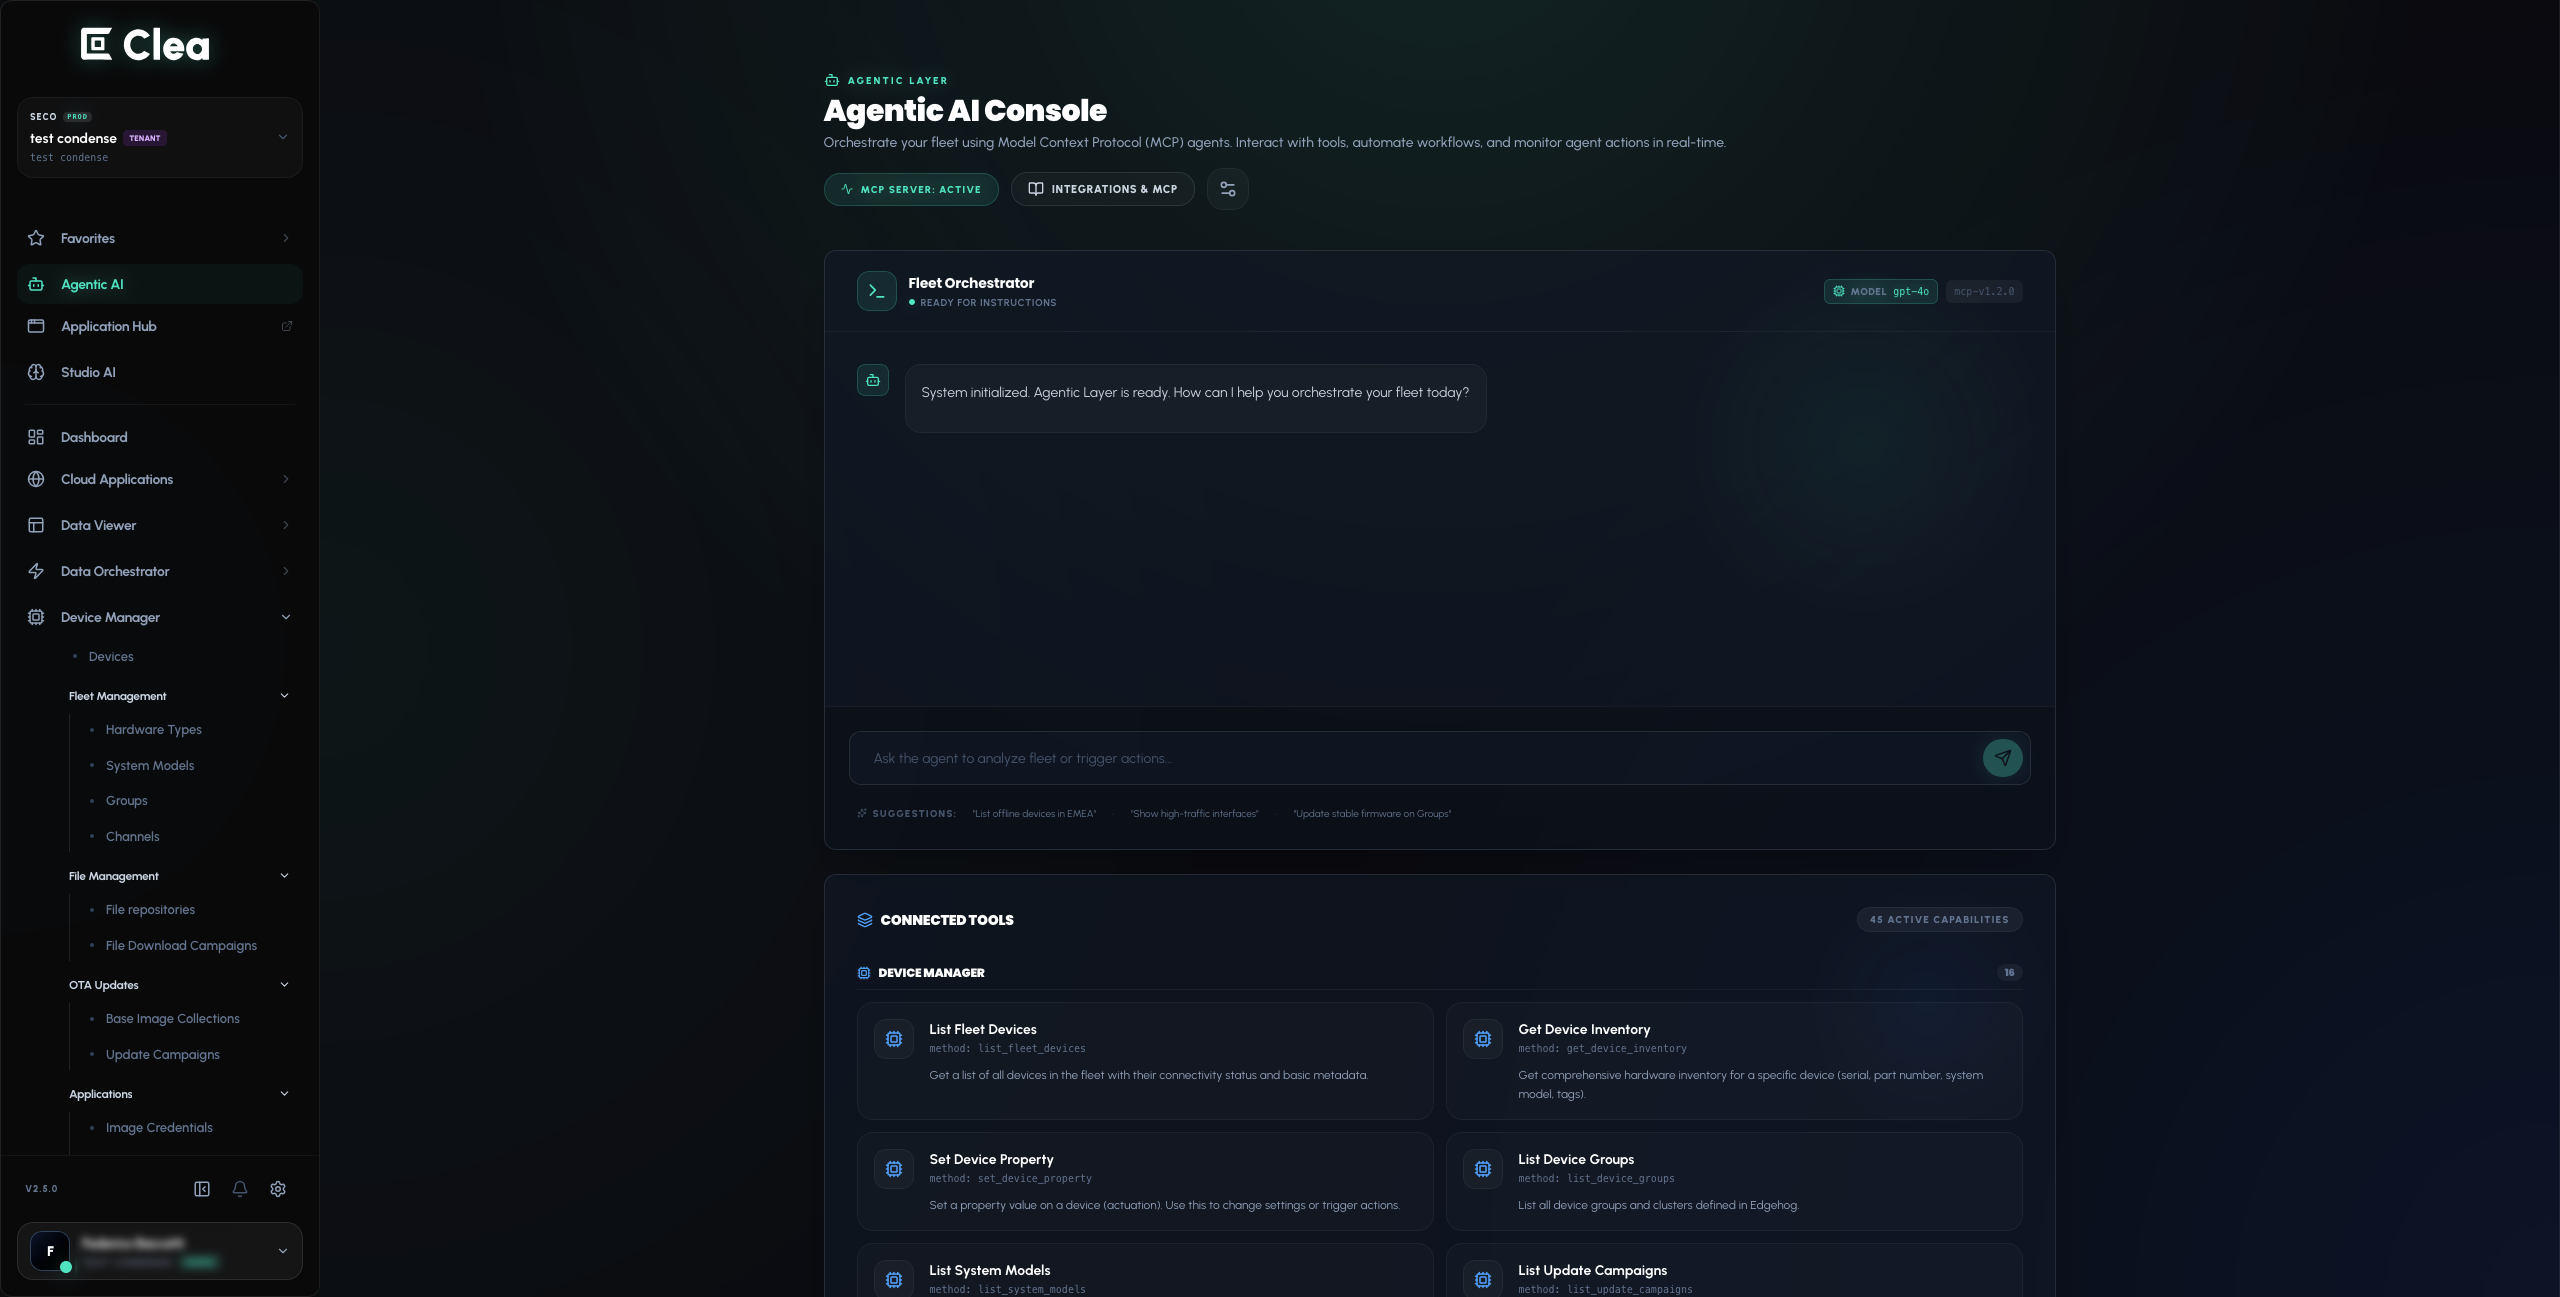
In the main navigation, select Agentic AI to open the Agentic AI Console.
-
Explore the Agentic AI Console and its Fleet Orchestrator interface.
-
Review the CONNECTED TOOLS and AGENT EXECUTION TRACE areas to understand which capabilities are exposed to the agent.
-
In the Agentic AI Console, select INTEGRATIONS & MCP to explore External LLM integrations and the supported external MCP clients.
-
Follow the configuration options available to your account if you intend to connect an external LLM provider.
Expected result: You can locate the agent console and identify which integration options are available in your Clea environment.
Important: AI-assisted actions can include operations that change devices or fleet configurations. Review the selected tools and permissions before asking the agent to execute an operation. Treat API keys and access tokens as secrets and never include them in ordinary prompts.
8. Explore Data Viewer
What you'll do: Find a connected appliance and inspect the telemetry that Clea receives from it.
Data Viewer is where you can inspect your appliances and the data associated with them. An appliance's detail page includes an overview, telemetry interfaces, tags and management options.
8.1. Find an appliance
-
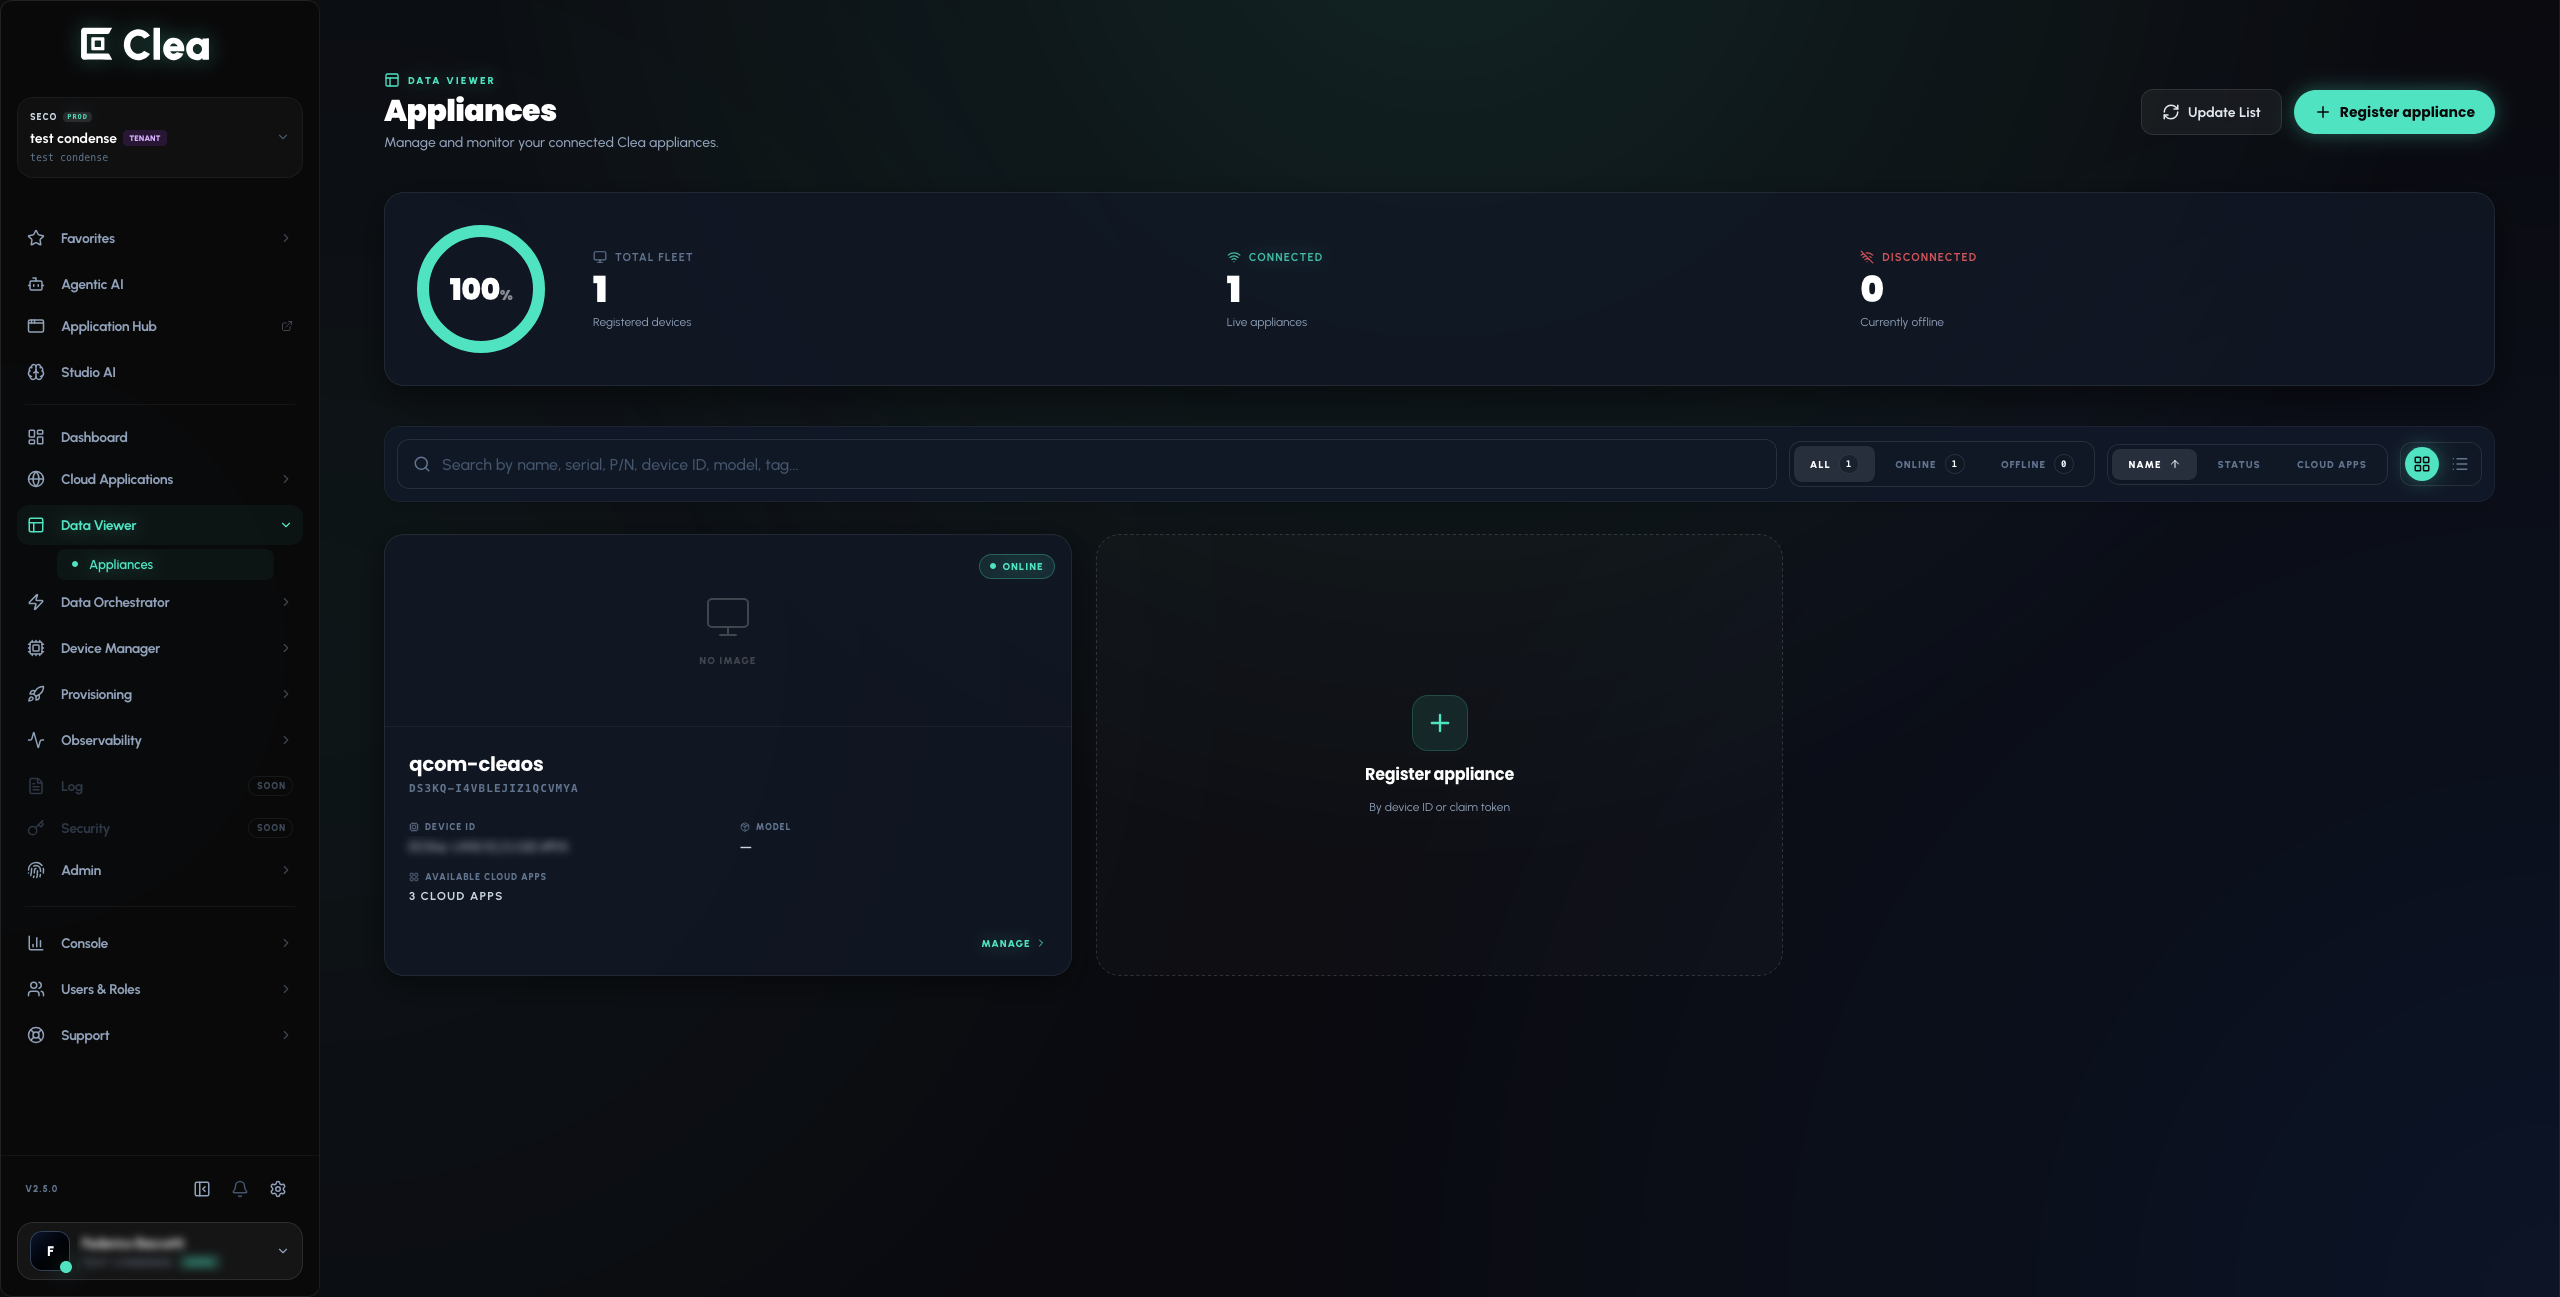
In the Clea main navigation, expand Data Viewer and select Appliances.
-
Use the search field, Search by name, serial, P/N, device ID, model, tag..., to locate your appliance, or select the ONLINE filter to show connected appliances.
-
Review the appliance details, including its connectivity status and available Cloud Apps. Switch between grid and list views if needed.
-
Select MANAGE on the appliance you want to inspect to open its details page.
-
In OVERVIEW, check SYSTEM ONLINE, the Last seen information and any available hardware, operating system, runtime and memory details.
8.2. Inspect live telemetry
- In the Data Viewer appliance details page, select the TELEMETRIES tab. The number shown next to this tab indicates how many telemetry entries are listed for that appliance.
- In Live Telemetry Analysis, review the available interfaces and their status labels, such as DYNAMIC, STATIC and NO DATA.
- Open an interface with available dynamic values, for example
io.edgehog.devicemanager.SystemStatus, if present on your appliance. - Inspect the reported values and timestamps. Depending on the interface, data may be shown in JSON form, including fields such as
timestamp,uptimeMillisand memory information. - Return to the appliance overview when finished. If you want to manage that physical device, use Open in Device Manager.
Expected result: You can identify a connected appliance, locate its telemetry interfaces and inspect the latest data available from the device.
Note: The interfaces and values depend on the device and on the data it publishes. If an appliance shows TELEMETRIES (0) or NO DATA, it does not have values to inspect in that view. Data Viewer also provides TAGS & METADATA and MANAGEMENT, but this introductory activity does not require changing appliance settings.
9. Explore Data Orchestrator
What you'll do: Browse data interfaces, create an interface definition using the visual editor or JSON, and inspect data delivery rules.
Data Orchestrator includes Interfaces, Triggers and Delivery Policies. An interface defines the structure of data exchanged between a device and the platform, including endpoint paths and data types. You can inspect existing interfaces and use the built-in editor to prepare a new one.
9.1. Browse existing interfaces and triggers
-
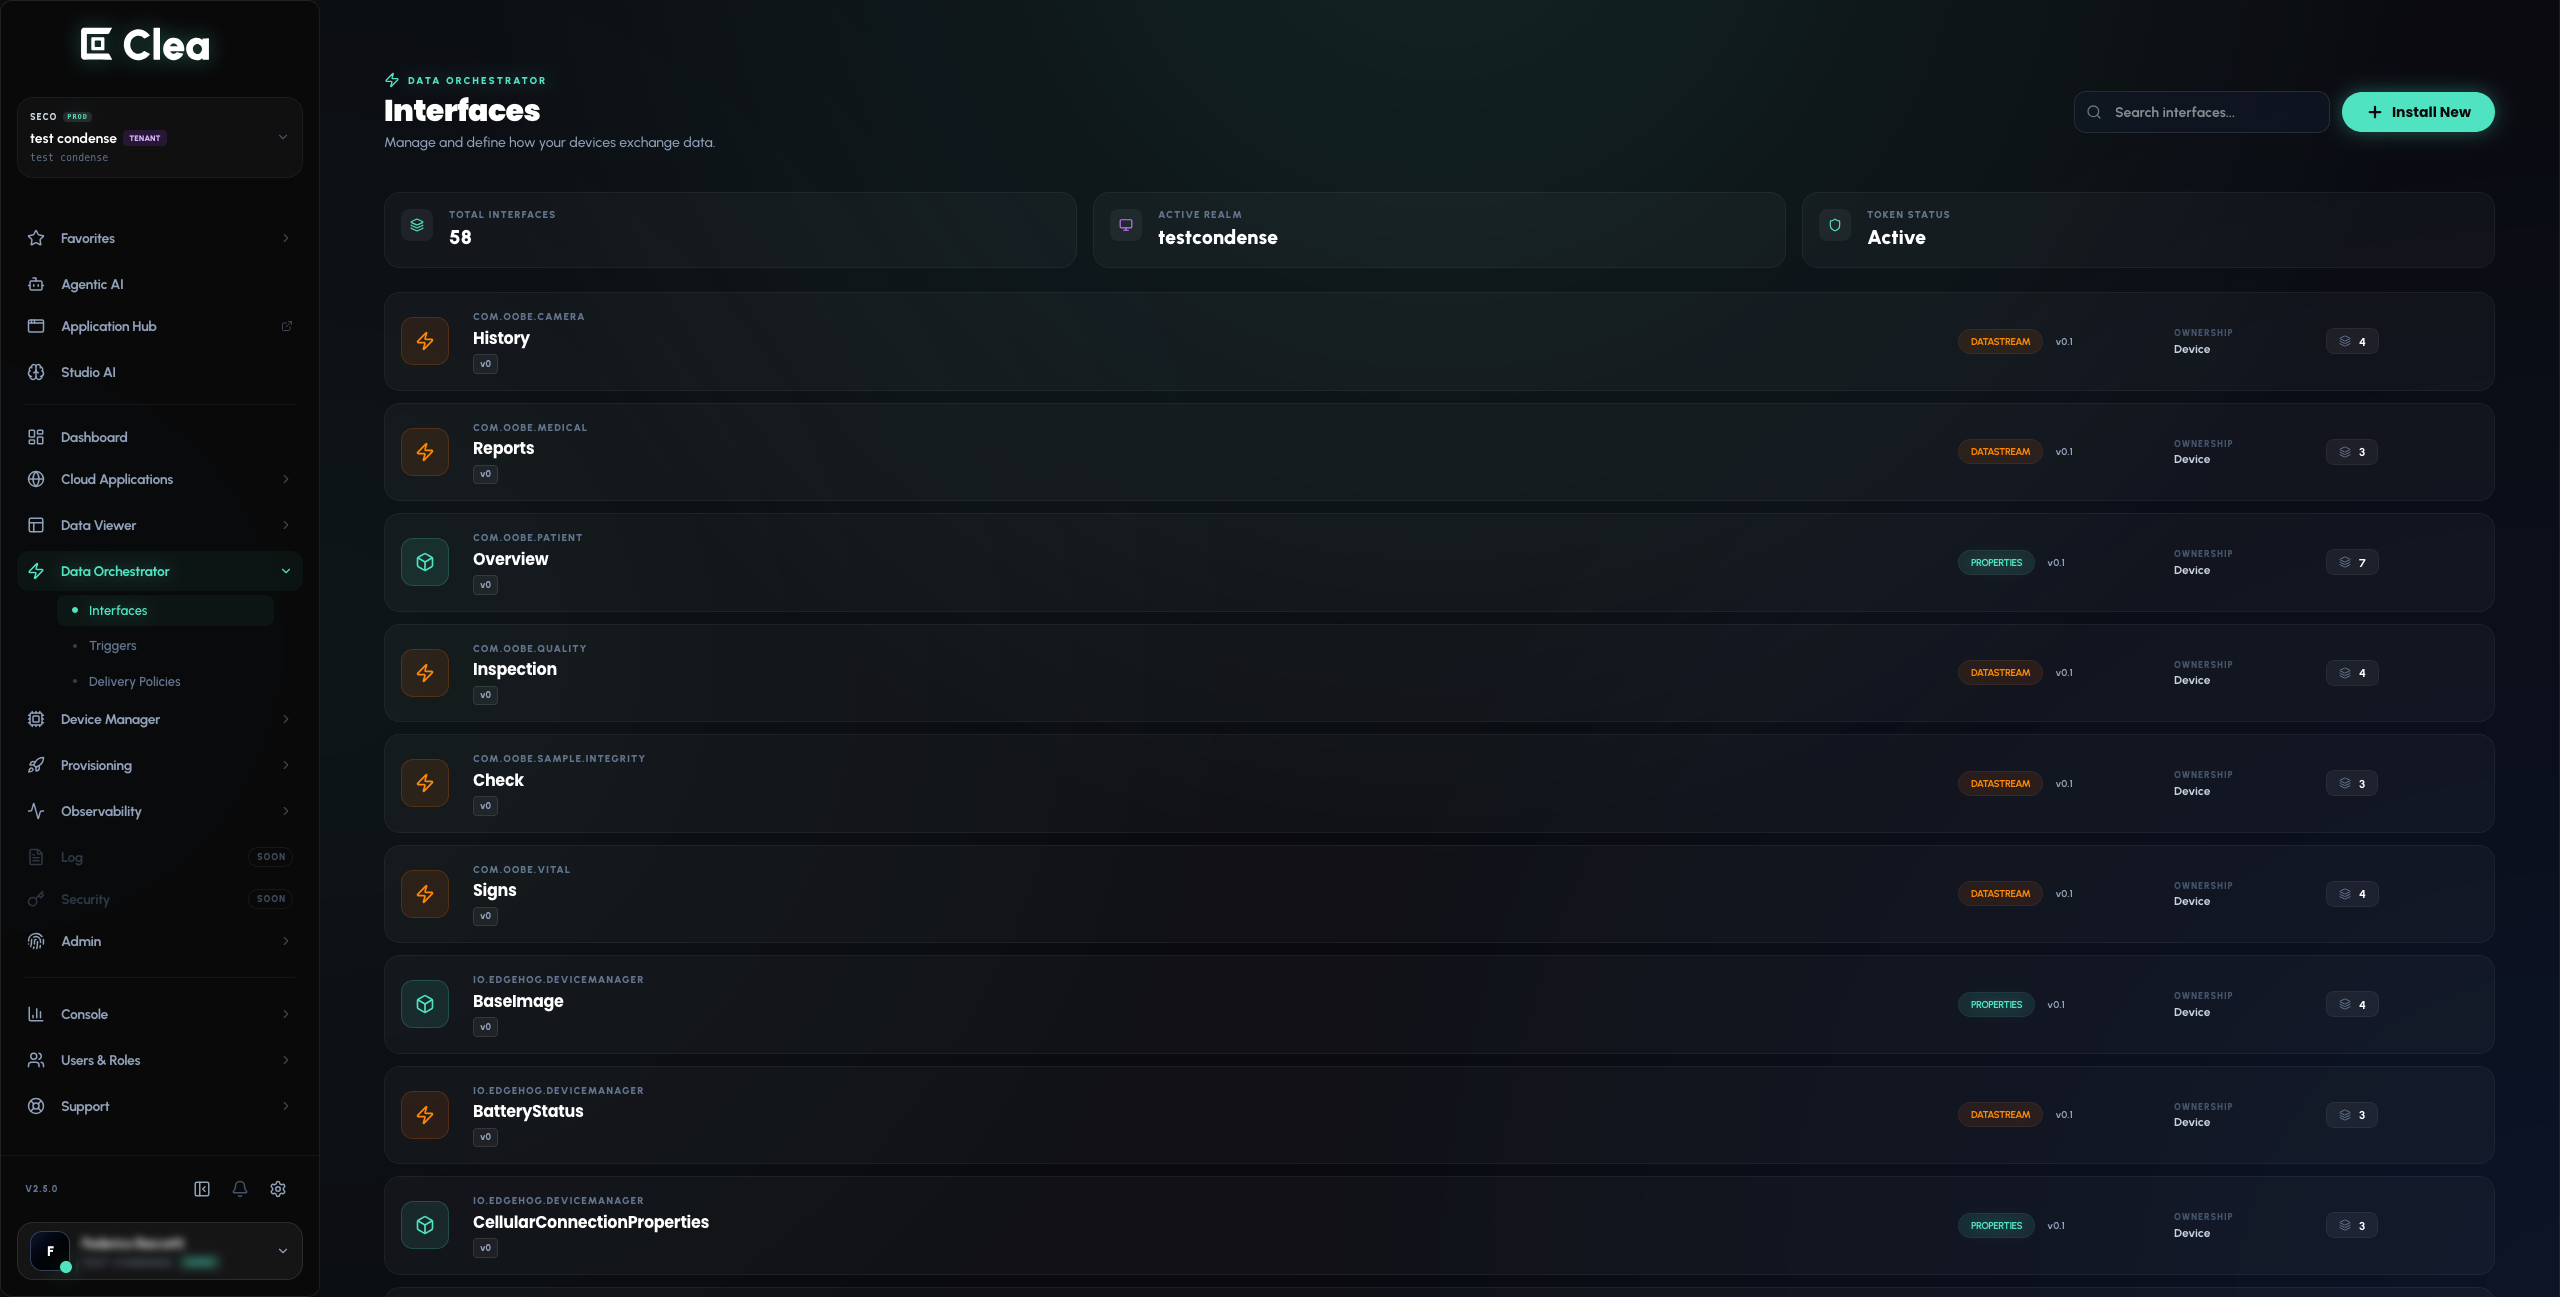
In the main navigation, expand Data Orchestrator.
-
Open Interfaces and review the available interface list.
-
Use Search interfaces... to find an interface by name, when interfaces are available in your environment.
-
Open Triggers to review the available trigger configurations. Select INSTALL to view the trigger editor and its DATA EVENTS and LIFECYCLE options.
-
Return to Interfaces to explore the interface installation entry point.
9.2. Create and install an interface
What you'll do: Define an interface using Clea's visual editor or JSON definition, and learn how to submit it for installation.
-
In the main navigation, expand Data Orchestrator and select Interfaces.
-
Check that ACTIVE REALM identifies the intended data-orchestration realm and that the interface list loads. If the realm is not configured, contact your Clea administrator before proceeding.
-
Select Install New to open the inline interface editor, prefilled with
com.example.NewInterface.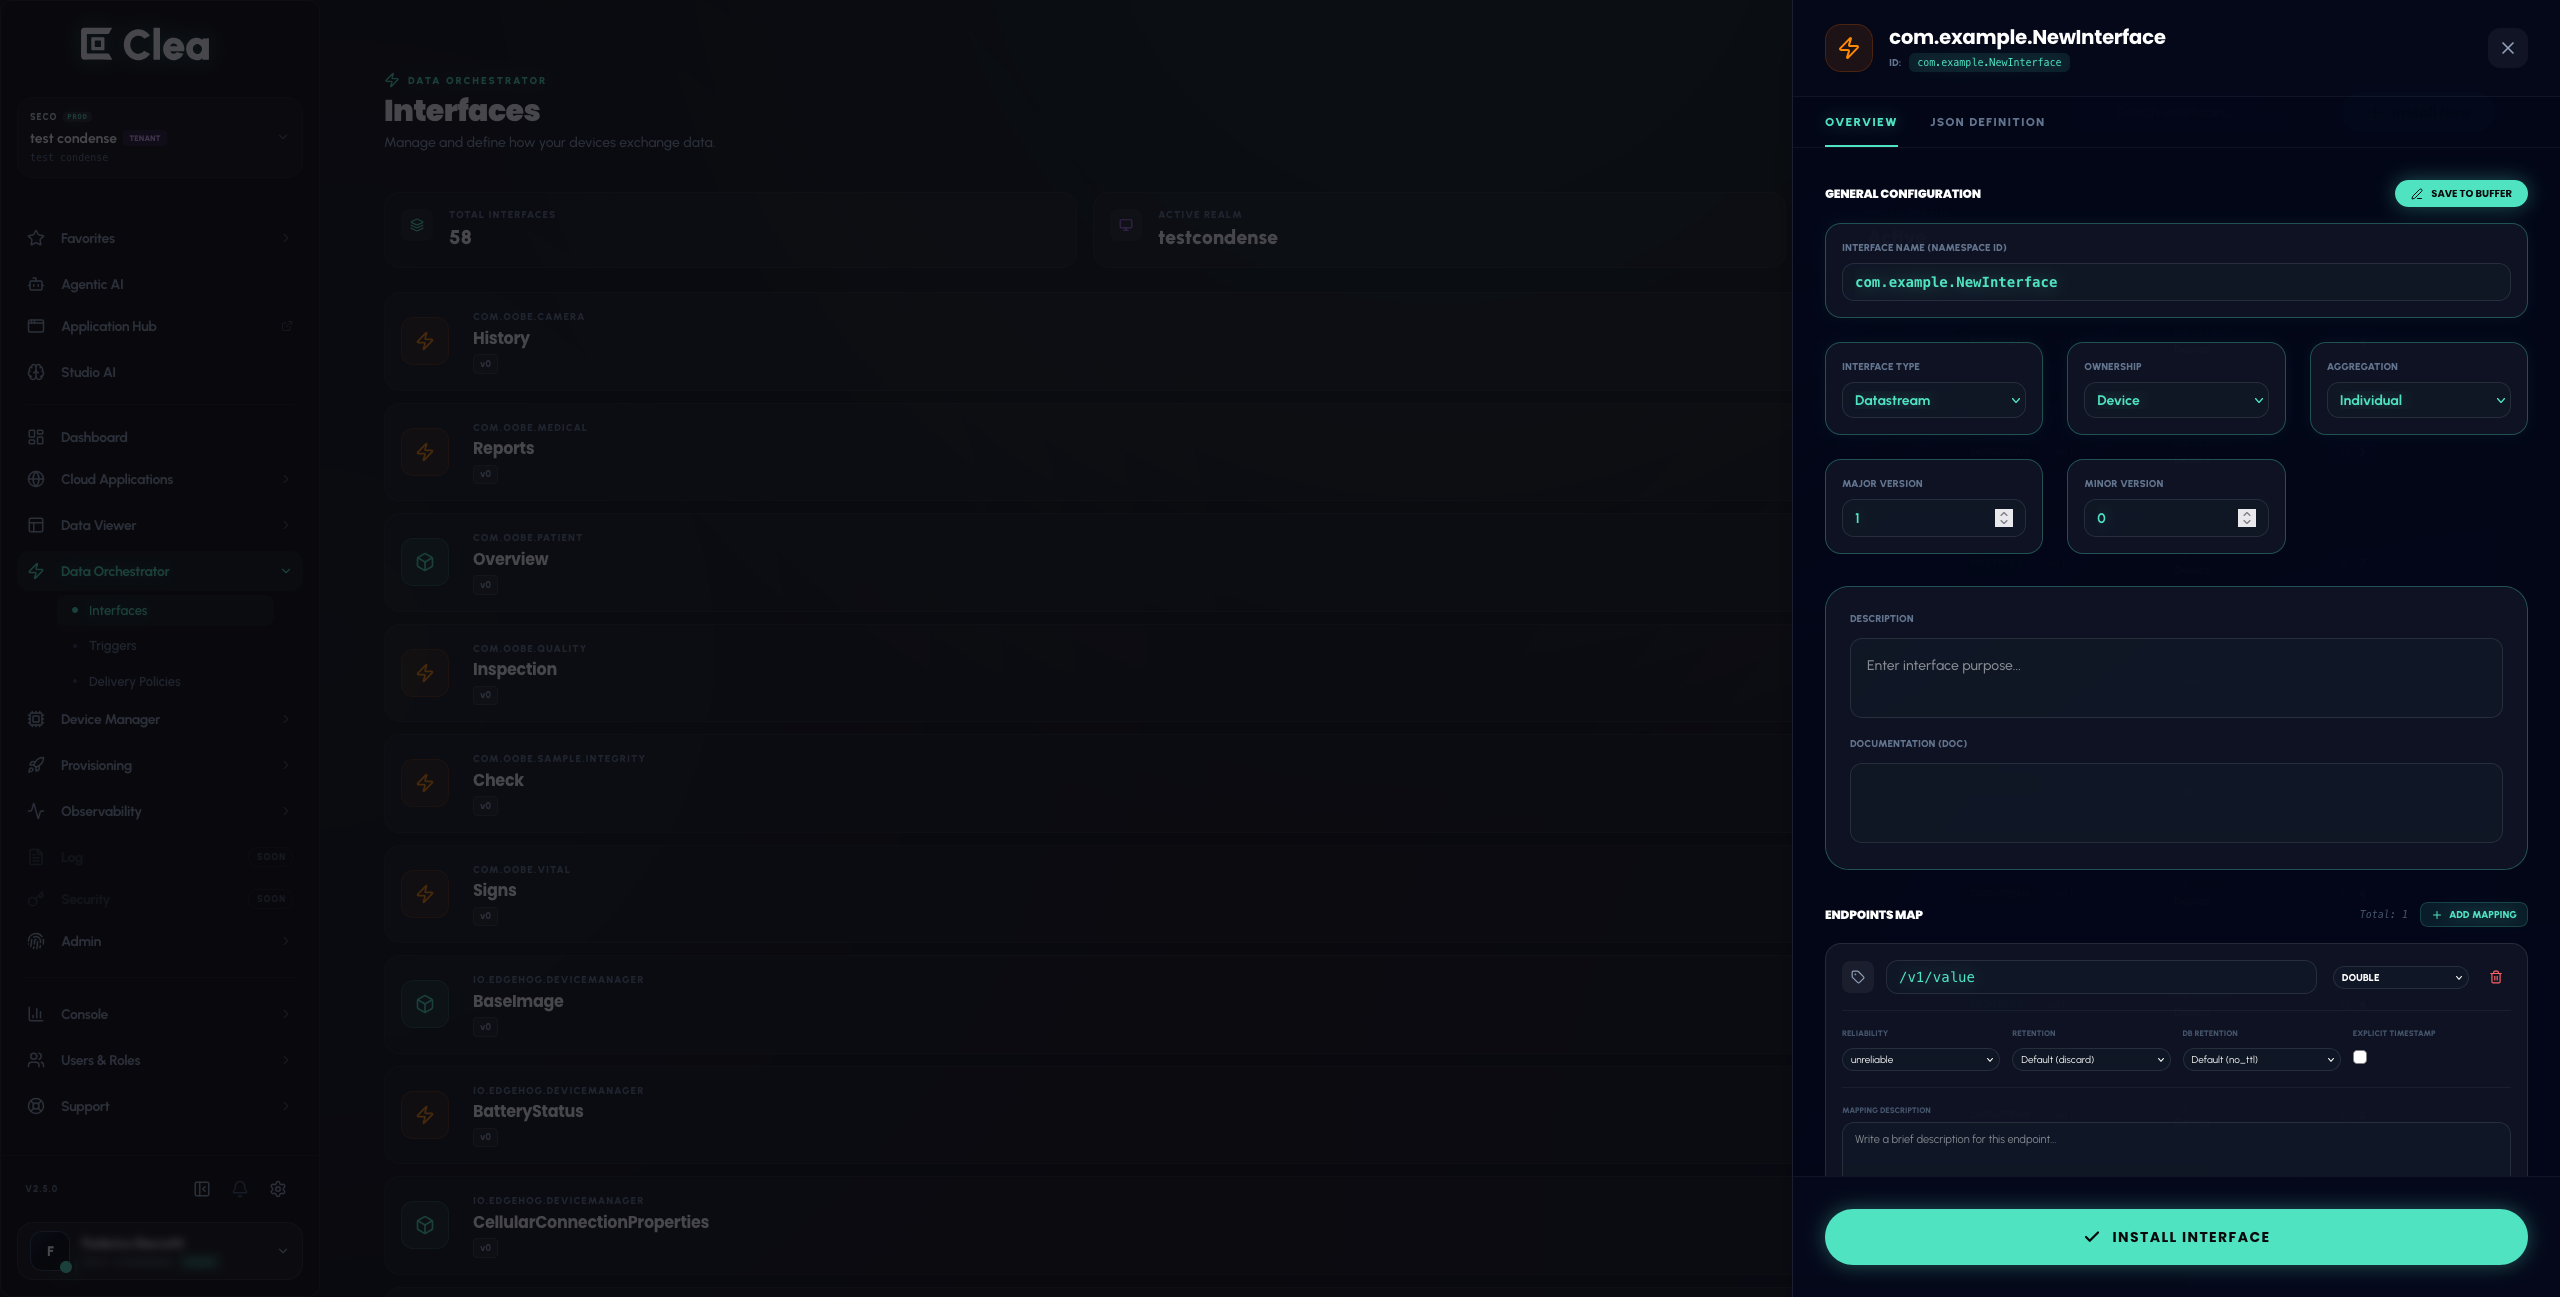
-
In OVERVIEW, under GENERAL CONFIGURATION, replace the sample INTERFACE NAME (NAMESPACE ID) with an appropriate name for your application.
-
Select the INTERFACE TYPE (Properties or Datastream), OWNERSHIP (Device or Server) and AGGREGATION (Individual or Object (Grouped)). Set the MAJOR VERSION and MINOR VERSION as required for your interface. Add a description or documentation if useful.
-
In ENDPOINTS MAP, configure the first mapping. The editor starts with an example endpoint
/v1/valueof typedouble. Replace it with your endpoint path and data type, and review RELIABILITY, RETENTION, DB RETENTION, EXPLICIT TIMESTAMP and MAPPING DESCRIPTION as needed. -
If the interface needs additional endpoints, select ADD MAPPING and configure each additional mapping.
-
Alternatively, open JSON DEFINITION to inspect the generated SCHEMA SOURCE. Use EDIT SOURCE if you prefer to edit the JSON directly, then return to the overview using the editor controls.
-
Review the complete definition, including the interface name, version, endpoint paths and data types. When you are ready to apply it to your configured environment, select INSTALL INTERFACE.
-
After a successful installation, return to Interfaces and use the list or Search interfaces... to find the new interface and check its name and version.
The JSON editor initially displays the following example definition:
{
  "interface_name": "com.example.NewInterface",
  "version_major": 1,
  "version_minor": 0,
  "type": "datastream",
  "ownership": "device",
  "aggregation": "individual",
  "mappings": [
    {
      "endpoint": "/v1/value",
      "type": "double",
      "reliability": "unreliable"
    }
  ]
}
Expected result: The interface definition is submitted for installation. If installation succeeds, you can find it in Interfaces and inspect its configuration.
Important: INSTALL INTERFACE changes the active data-orchestration environment. Review the schema and use an authorized environment before submitting it.
9.3. Inspect a delivery policy
- In the main navigation, expand Data Orchestrator and select Delivery Policies.
- Review the available policies and use Filter policies... if needed.
- Open a policy that is already present in your environment.
- Inspect its Active Manifest and the displayed settings. Depending on the policy, these may include MAXIMUM CAPACITY, RETRY TIMES, EVENT TTL (SECONDS), PREFETCH COUNT and an ERROR HANDLING MATRIX.
- Return to the policy list without changing the configuration.
Expected result: You can locate the interface editor and inspect the delivery policies used to configure how data is handled.
Tip: To inspect telemetry already published by a connected device, follow section 8.
10. Explore OTA Updates
What you'll do: Find the firmware distribution and update-campaign areas used to manage remote software updates.
Clea groups OTA-related functionality under Device Manager > OTA Updates. Start by reviewing firmware image collections and update campaigns.
10.1. Explore base image collections
-
In the Clea main navigation, expand Device Manager, expand its OTA Updates group, then select Base Image Collections.
-
Review the available collections and versions, if any are registered in your environment.
-
Use the search control to find a collection if the list contains multiple entries.
-
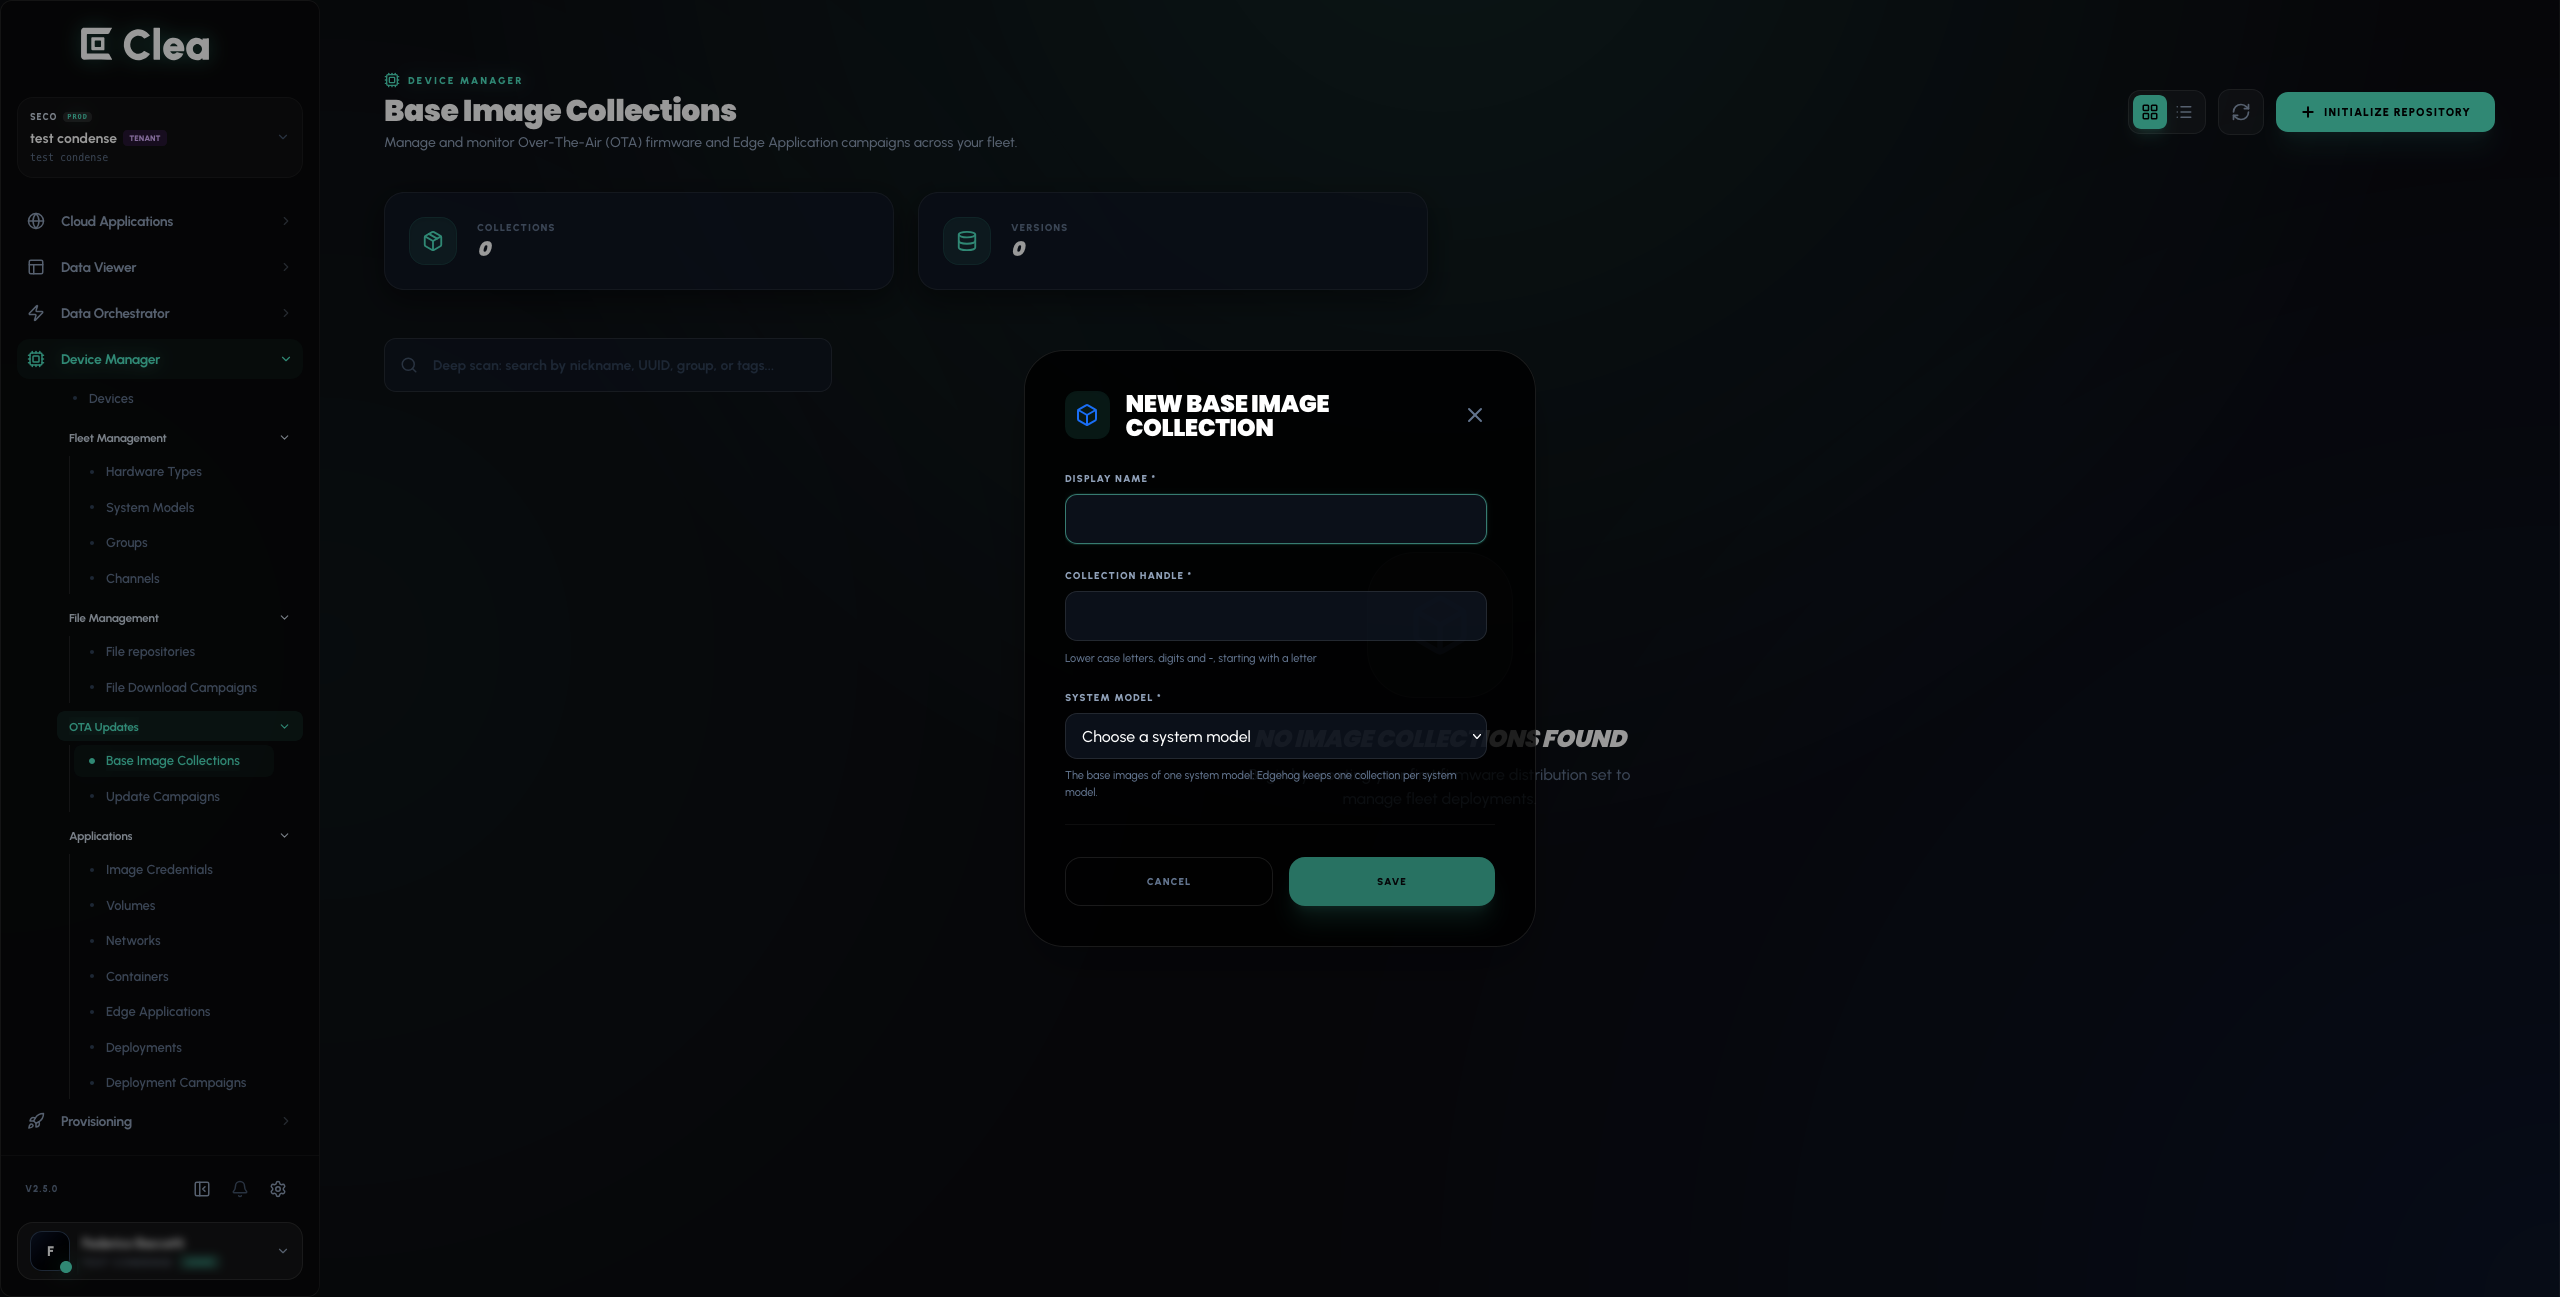
Select INITIALIZE REPOSITORY to inspect the NEW BASE IMAGE COLLECTION form, including DISPLAY NAME, COLLECTION HANDLE and SYSTEM MODEL. Close the form without selecting SAVE if you are only exploring.
10.2. Find update campaigns and device compatibility settings
- In the main navigation, expand Device Manager > OTA Updates and select Update Campaigns.
- Review the existing campaigns and their statuses. Locate New Campaign / NEW CAMPAIGN to see where campaign creation begins.
- To understand how update eligibility is organized, return to the main navigation and expand Device Manager, then open Fleet Management. Select System Models, Hardware Types or Channels to inspect their settings.
- In Device Manager > Devices, check the connectivity status of your device before considering any OTA operation.
10.3. Inspect the device's software update controls
-
In the main navigation, open Device Manager > Devices and select your device.
-
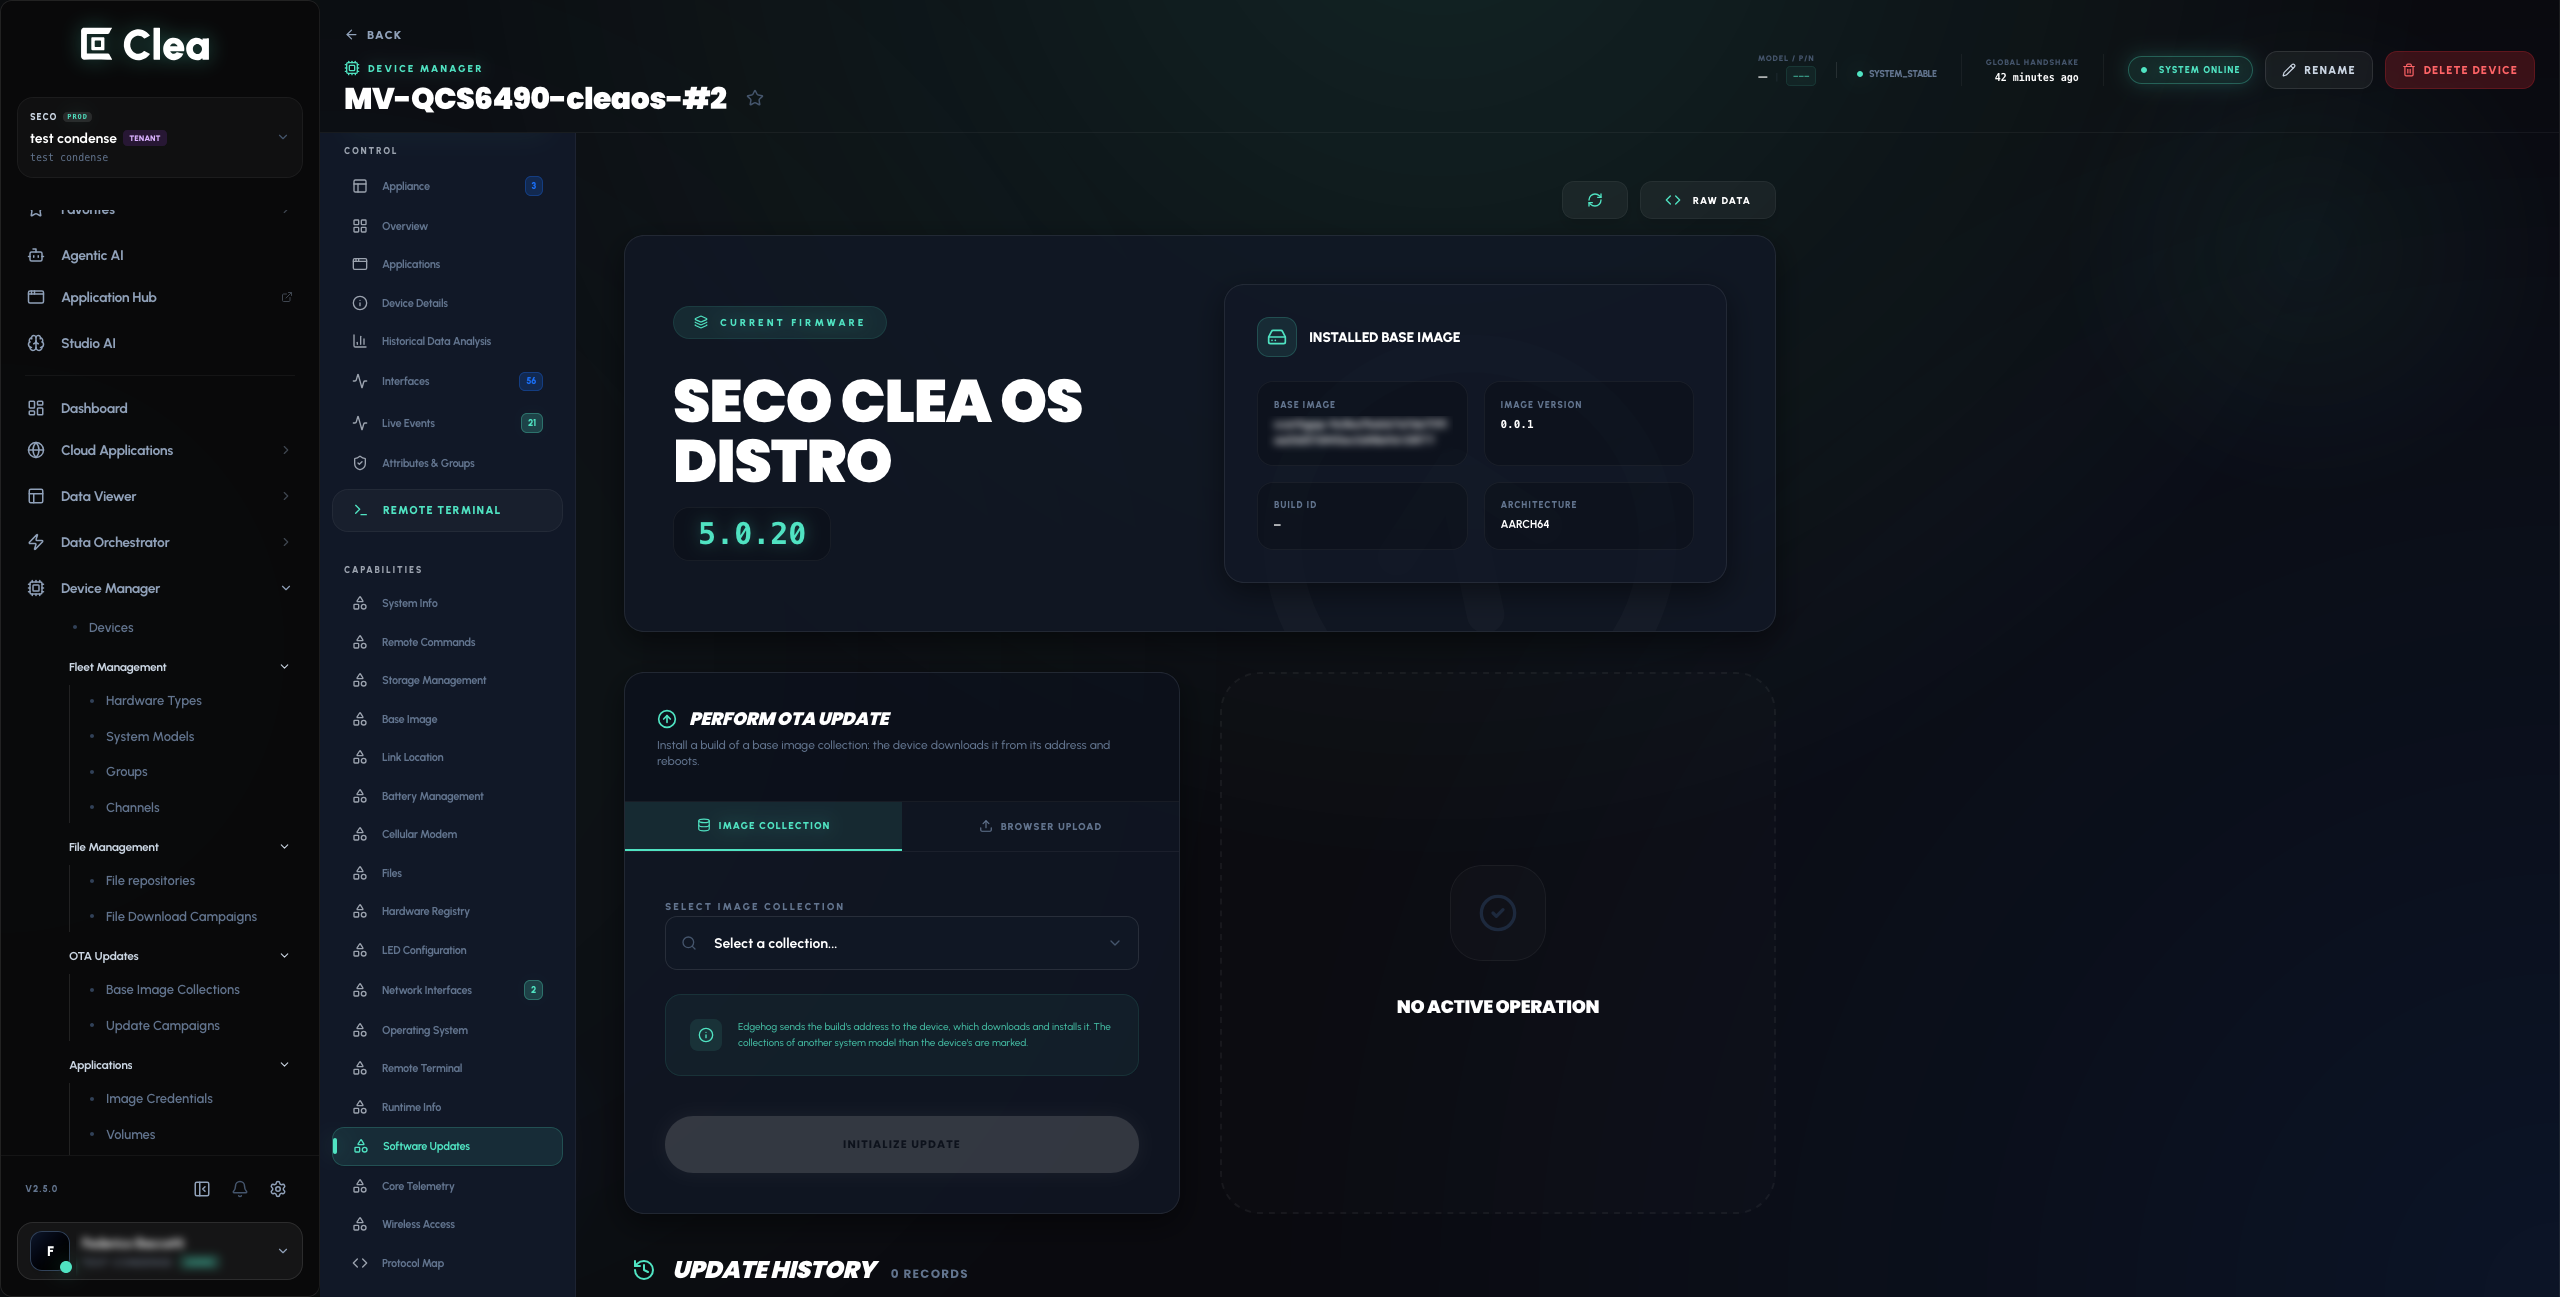
In the device details navigation on the left, under CAPABILITIES, select Software Updates.
-
Find PERFORM OTA UPDATE and inspect the available options: IMAGE COLLECTION and BROWSER UPLOAD.
-
Review SELECT IMAGE COLLECTION, when an image collection is available, and the UPDATE HISTORY section.
-
Do not select INITIALIZE UPDATE unless you intend to perform an authorized firmware update on this device.
Expected result: You can find the global OTA management pages and the device-specific software update controls, without modifying the device's software.
Important: Applying an OTA update changes software on a physical device and may temporarily interrupt availability. Confirm the supported image formats, A/B behavior, rollback options and prerequisites for your target device before starting an update.
What's next?
You have explored the essential Clea 2.0 workflows: checking a device connection, remote access, commands, file transfer, containerized applications, Application Hub, Studio AI, Agentic AI, Data Viewer, Data Orchestrator and the OTA update management interface.
Continue with the features most relevant to your use case. For production activities such as deploying a new application release, changing data orchestration policies or applying firmware updates, use a compatible device and confirm the required account permissions and configuration before proceeding.